





Ever wondered how your income stacks up against the rest of the country? Or where you might have the best luck finding high-end op shop steals? Each year the Australian Taxation Office (ATO) surveys millions of tax returns from previous financial years to give a snapshot of the country’s earning patterns.
The most recent data, from the 2023-2024 financial year, analyses the tax returns of 16.5 million Australian residents, finding the richest postcodes with the highest average taxable income, as well as the poorest postcodes with the lowest.
What are the richest suburbs in Australia?
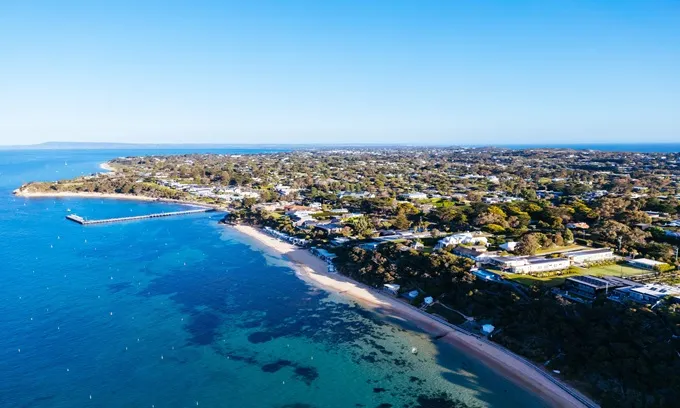
Victoria’s Portsea took out the top spot as the richest suburb in Australia, with its 656 residents bringing in an average taxable income of nearly $322,000. That’s almost four times the national average of $81,244.
Located on the Mornington Peninsula, just one and a half hours drive south of Melbourne City, Portsea also has a median house price of $2.9 million, per realestate.com.au. That’s almost $2 million more than the national median dwelling value of $937,722, as reported by Cotality.
And if that made you baulk, you may be shocked to learn it offered the lowest median house price of any of the top 10 highest-earning suburbs. Sydney’s exclusive harbourside suburb of Point Piper has the highest median house price among the lot – an eyewatering $23.5 million.
While Australia’s richest postcodes are topped by two Victorian locales, it was mostly dominated by affluent areas of Greater Sydney, with the city taking out seven spots in the top 10.
Postcode | Suburb | Individuals | Average | Median |
|---|---|---|---|---|
3944 | Portsea – VIC | 656 | $321,988 | $2,935,000 |
3142 | Hawksburn, | 9,933 | $277,708 | $4,675,000 |
2023 | Bellevue Hill – NSW | 7,814 | $250,899 | $11,000,000 |
2030 | Dover Heights, | 10,094 | $246,732 | Dover Heights: |
6011 | Cottesloe, | 7,150 | $239,013 | Cottesloe: |
2027 | Darling Point, | 5,966 | $238,954 | Darling Point: |
2025 | Woollahra – NSW | 5,361 | $214,893 | $4,525,000 |
2110 | Hunters Hill, | 6,392 | $214,626 | Hunters Hill: |
2028 | Double Bay – NSW | 3,448 | $212,209 | $8,400,000 |
2088 | Mosman, | 20,276 | $208,097 | $5,325,000 |
Source: Australian Taxation Office (ATO). Taxation Statistics 2023-24 Individuals: Top 10 highest-earning postcodes by average taxable income, 2023-24 income year. Median house prices July 2025-June 2026, sourced from realestate.com.au.
How much could a mortgage in Australia’s richest suburbs cost you?
Dreaming of what it would be like to live in some of these glitzy postcodes? The potential mortgage nightmare could shock you back into reality.
Considering a median house in Portsea costs around $2.9 million, you’d need a $587,000 deposit to walk away with a loan-to-value ratio (LVR) of 80%. Then, if you were to take out a 30-year home loan at the average variable rate on Canstar’s database of 6.66% p.a., your repayments could set you back almost $15,000 a month, according to Canstar’s mortgage repayment calculator.
Still not scared? How about a hypothetical mortgage in Point Piper, where an $23.5 million dollar house could demand a $4.7 million deposit and come with a monthly repayment of more than $120,800, or nearly $1.45 million a year!
While you’re unlikely to be making such repayments on your own home loan (though we might be wrong!), you could be paying more than you need to.
Check the rates on Canstar’s database and compare them to what you’re currently paying. If your rate isn’t competitive, you may be able to call your lender and negotiate a better rate or consider refinancing to a lower rate with a new lender.
What are the poorest suburbs in Australia?
For the poorest postcodes, regional Queensland’s 4467 postcode, (which includes Mungallala, Mungallala South, Redford, and Tyrconnel) reported the lowest average taxable income of $17,164, about a fifth of the national average.
But, to put this in perspective, Mungallala has a median house price of $37,000. Meaning, while taxable incomes are low in the area, so are house prices.
Newcastle’s 2308 postcode, which covers Callaghan and Newcastle University, was the second lowest-earning suburb, with an average income of $22,177.
The rest of the list was made up of small communities in Queensland, South Australia, and Victoria, all of which had under 300 taxpayers each.
Postcode | Suburb | Individuals | Average | Median |
|---|---|---|---|---|
4467 | Mungallala, | 115 | $17,164 | Mungallala: |
2308 | Callaghan, | 233 | $22,177 | Not |
4498 | Kioma, | 101 | $25,119 | Not |
4497 | Daymar, | 213 | $31,079 | Thallon: |
5308 | Copeville, | 66 | $31,372 | Not |
4612 | Hivesville, | 165 | $34,397 | Hivesville: |
3889 | Bellbird Creek, | 79 | $34,461 | Bemm River: |
4426 | Jackson, | 76 | $34,765 | Not |
4427 | Clifford, | 218 | $35,155 | Yuleba: |
2876 | Bogan Gate, | 261 | $35,259 | Bogan Gate: |
Source: Australian Taxation Office (ATO). Taxation Statistics 2023-24 Individuals: Top 10 lowest-earning postcodes by average taxable income, 2023-24 income year. Median house prices July 2025-June 2026, sourced from realestate.com.au.