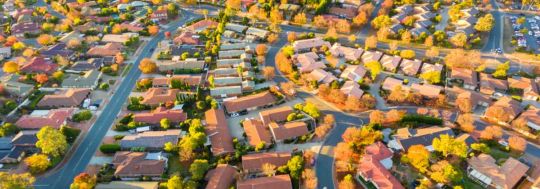
The suburbs where it may be cheaper to buy than rent
CoreLogic has tracked down the suburbs around Australia where mortgage payments may be less than the rent by as much as $1,000.
There’s no denying that home affordability is an issue around Australia. What might surprise you, though, is that there are a number of locations around Australia where mortgage repayments may actually be cheaper than rent.
CoreLogic has done the number-crunching to find the suburbs where that is the case. The calculations assume you have a 20% deposit, as well as enough money to pay stamp duty and any other upfront costs that come with buying a property.
Darwin units top the list of the capital cities where it is cheaper to buy than rent. The monthly home loan repayments are $1,078 less than what it would cost you to rent a unit! The monthly difference is not quite as big in some of the other cities.
Of course, it helps that interest rates are at historic lows as the repayments are based on paying 2.44%pa. If interest rates were higher some of the locations might not be cheaper to buy than rent.
Something else to keep in mind is that owning a home will cost you more than just the mortgage repayments. Some of the other ongoing expenses you’ll need to budget for include insurance, council rates as well as repairs and maintenance.
Greater Brisbane
There are opportunities in Brisbane to save between $600 and nearly $800 a month by buying a house or unit instead of renting. Top of the list is Kilcoy, which is about an hour out of Brisbane. The monthly repayments on a house are potentially $793 less than the cost of renting. There are also a number of locations closer to Brisbane including units in Spring Hill and Fortitude Valley.
Greater Brisbane Houses
← Mobile/tablet users, scroll sideways to view full table →
| Suburb | SA4 Region | Median rent |
Median value |
Monthly payments |
Monthly rent |
Monthly difference |
|---|---|---|---|---|---|---|
| Kilcoy | Moreton Bay North |
$395 | $293,137 | $919 | $1,712 | -$793 |
| Macleay Island | Brisbane East | $379 | $291,736 | $915 | $1,644 | -$729 |
| Russell Island | Brisbane East | $346 | $255,455 | $801 | $1,501 | -$699 |
| Kingston | Logan- Beaudesert |
$383 | $317,504 | $996 | $1,658 | -$662 |
| Bellbowrie | Brisbane West | $608 | $630,268 | $1,977 | $2,633 | -$656 |
| Riverview | Ipswich | $331 | $249,787 | $783 | $1,435 | -$651 |
| Goodna | Ipswich | $367 | $299,910 | $941 | $1,589 | -$649 |
| Waterford West |
Logan- Beaudesert |
$401 | $348,071 | $1,092 | $1,738 | -$646 |
| Eagleby | Logan- Beaudesert |
$376 | $315,360 | $989 | $1,629 | -$640 |
| Logan Central | Logan- Beaudesert |
$369 | $312,017 | $979 | $1,599 | -$620 |
Source information for all tables:
Source: Core Logic. Data as at 31 March, 2021. This used median value and rent data to March 2021 to determine the average monthly cost to service a mortgage vs rental payments based on the following assumptions: Loan based on 80% of median value, meaning 20% of the property value is required as a deposit; an interest rate of 2.44%pa (based on RBA Lending rate); repayments are principal and interest over a loan term of 30 years. Suburbs with less than 50 sales, 20 rental observations and 100 valid avm’s were excluded from the analysis.
Greater Brisbane Units
← Mobile/tablet users, scroll sideways to view full table →
| Suburb | SA4 Region | Median rent |
Median value |
Monthly payments |
Monthly rent |
Monthly difference |
|---|---|---|---|---|---|---|
| Deception Bay | Moreton Bay North |
$356 | $260,430 | $817 | $1,544 | -$727 |
| South Brisbane | Brisbane Inner City |
$505 | $470,411 | $1,475 | $2,188 | -$713 |
| Eight Mile Plains |
Brisbane South | $445 | $393,723 | $1,235 | $1,928 | -$693 |
| Woodridge | Logan- Beaudesert |
$281 | $169,878 | $533 | $1,218 | -$685 |
| Springwood | Logan- Beaudesert |
$360 | $281,340 | $882 | $1,560 | -$677 |
| Eagleby | Logan- Beaudesert |
$315 | $221,115 | $693 | $1,363 | -$670 |
| Spring Hill | Brisbane Inner City |
$433 | $385,806 | $1,210 | $1,875 | -$665 |
| Fortitude Valley | Brisbane Inner City |
$436 | $393,115 | $1,233 | $1,887 | -$654 |
| Brendale | Moreton Bay South |
$359 | $292,163 | $916 | $1,556 | -$640 |
| Runcorn | Brisbane South | $392 | $341,522 | $1,071 | $1,700 | -$629 |
Source: CoreLogic. Details on assumptions can be found here (or under the Greater Brisbane Houses table displayed above).
Greater Sydney
When looking at houses all 10 locations to feature on the list are on the NSW Central Coast which is about one hour away from Sydney. The monthly difference between loan repayments and rent are quite modest ranging from $223 to $364.
Greater Sydney Houses
← Mobile/tablet users, scroll sideways to view full table →
| Suburb | SA4 Region | Median rent |
Median value |
Monthly payments |
Monthly rent |
Monthly difference |
|---|---|---|---|---|---|---|
| Blue Haven | Central Coast | $495 | $568,639 | $1,783 | $2,147 | -$364 |
| Lake Haven | Central Coast | $477 | $544,806 | $1,709 | $2,065 | -$356 |
| Watanobbi | Central Coast | $473 | $547,795 | $1,718 | $2,052 | -$334 |
| San Remo | Central Coast | $460 | $532,877 | $1,671 | $1,993 | -$322 |
| Narara | Central Coast | $578 | $705,396 | $2,212 | $2,504 | -$292 |
| Mannering Park | Central Coast | $467 | $552,665 | $1,733 | $2,022 | -$289 |
| Kanwal | Central Coast | $464 | $554,092 | $1,738 | $2,011 | -$274 |
| Lake Munmorah | Central Coast | $469 | $560,945 | $1,759 | $2,032 | -$273 |
| Gorokan | Central Coast | $446 | $534,971 | $1,678 | $1,931 | -$254 |
| Summerland Point |
Central Coast | $479 | $590,628 | $1,852 | $2,075 | -$223 |
Source: CoreLogic. Details on assumptions can be found here (or under the Greater Brisbane Houses table displayed above).
Greater Sydney Units
← Mobile/tablet users, scroll sideways to view full table →
| Suburb | SA4 Region | Median rent | Median value | Monthly payments | Monthly rent | Monthly difference |
|---|---|---|---|---|---|---|
| West Gosford | Central Coast | $455 | $487,865 | $1,530 | $1,971 | -$441 |
| Gosford | Central Coast | $449 | $490,256 | $1,537 | $1,945 | -$408 |
| Mount Druitt | Blacktown | $357 | $387,245 | $1,214 | $1,547 | -$332 |
| Auburn | Parramatta | $427 | $500,241 | $1,569 | $1,851 | -$282 |
| Woy Woy | Central Coast | $466 | $556,144 | $1,744 | $2,018 | -$273 |
| Campbelltown | Outer South West | $393 | $462,991 | $1,452 | $1,701 | -$250 |
| East Gosford | Central Coast | $493 | $601,983 | $1,888 | $2,136 | -$248 |
| Penrith | Outer West & Blue Mount. |
$388 | $457,273 | $1,434 | $1,681 | -$247 |
| Jamisontown | Outer West & Blue Mount. |
$355 | $414,595 | $1,300 | $1,540 | -$240 |
| Toongabbie | Blacktown | $444 | $539,469 | $1,692 | $1,924 | -$232 |
Source: CoreLogic. Details on assumptions can be found here (or under the Greater Brisbane Houses table displayed above).
ACT
The nation’s capital has some of the largest differences between repayments and rents with the monthly difference ranging from $489 to $983. Based on the median values, renting a house in Chisholm would set you back $2,727 a month while the monthly repayments on a loan would be $2,019 – a difference of $708.
ACT Houses
← Mobile/tablet users, scroll sideways to view full table →
| Suburb | Median rent |
Median value |
Monthly payments |
Monthly rent |
Monthly difference |
|---|---|---|---|---|---|
| Chisholm | $629 | $643,753 | $2,019 | $2,727 | -$708 |
| Holt | $593 | $611,743 | $1,918 | $2,568 | -$650 |
| Latham | $603 | $635,094 | $1,992 | $2,614 | -$622 |
| Charnwood | $549 | $572,085 | $1,794 | $2,379 | -$585 |
| Higgins | $607 | $653,225 | $2,049 | $2,629 | -$581 |
| Kambah | $626 | $681,635 | $2,138 | $2,711 | -$574 |
| Macgregor | $592 | $639,462 | $2,005 | $2,565 | -$559 |
| Dunlop | $645 | $718,256 | $2,253 | $2,795 | -$542 |
| Ngunnawal | $597 | $666,857 | $2,091 | $2,586 | -$495 |
| Rivett | $629 | $712,855 | $2,236 | $2,724 | -$489 |
Source: CoreLogic. Details on assumptions can be found here (or under the Greater Brisbane Houses table displayed above).
ACT Units
← Mobile/tablet users, scroll sideways to view full table →
| Suburb | Median rent |
Median value |
Monthly payments |
Monthly rent |
Monthly difference |
|---|---|---|---|---|---|
| City | $608 | $527,356 | $1,654 | $2,637 | -$983 |
| Lyneham | $515 | $414,462 | $1,300 | $2,232 | -$932 |
| Braddon | $544 | $455,366 | $1,428 | $2,356 | -$928 |
| Wright | $505 | $423,851 | $1,329 | $2,187 | -$858 |
| Watson | $495 | $418,054 | $1,311 | $2,143 | -$832 |
| Gungahlin | $473 | $389,296 | $1,221 | $2,052 | -$831 |
| Turner | $578 | $534,554 | $1,676 | $2,504 | -$828 |
| Phillip | $472 | $399,620 | $1,253 | $2,045 | -$792 |
| Franklin | $479 | $417,338 | $1,309 | $2,077 | -$769 |
| Greenway | $487 | $432,495 | $1,356 | $2,110 | -$753 |
Source: CoreLogic. Details on assumptions can be found here (or under the Greater Brisbane Houses table displayed above).
Greater Melbourne
In Melbourne you may have better luck with units rather than houses. As the table below shows, the monthly difference between repayments and rent could be as high as $467. This is based on a unit in Carlton. The gap is much narrower when looking at houses in Melbourne. In Somerville, for example, the monthly difference is just $3.
Greater Melbourne Houses
← Mobile/tablet users, scroll sideways to view full table →
| Suburb | SA4 Region | Median rent |
Median value |
Monthly payments |
Monthly rent |
Monthly difference |
|---|---|---|---|---|---|---|
| Hastings | Mornington Peninsula |
$502 | $595,641 | $1,868 | $2,176 | -$308 |
| Melton | West Melbourne | $341 | $408,591 | $1,281 | $1,477 | -$196 |
| Kurunjang | West Melbourne | $361 | $474,856 | $1,489 | $1,566 | -$77 |
| Koo Wee Rup | South East Melb. |
$439 | $585,582 | $1,836 | $1,900 | -$64 |
| Melton South | West Melbourne | $364 | $486,234 | $1,525 | $1,578 | -$53 |
| Diggers Rest | North West Melb. |
$427 | $578,334 | $1,814 | $1,851 | -$37 |
| Harkness | West Melbourne | $375 | $513,446 | $1,610 | $1,626 | -$15 |
| Meadow Heights | North West Melb. | $392 | $538,712 | $1,689 | $1,698 | -$9 |
| Somerville | Mornington Peninsula |
$545 | $751,459 | $2,357 | $2,360 | -$3 |
Source: CoreLogic. Details on assumptions can be found here (or under the Greater Brisbane Houses table displayed above).
Greater Melbourne Units
← Mobile/tablet users, scroll sideways to view full table →
| Suburb | SA4 Region | Median rent |
Median value |
Monthly payments |
Monthly rent |
Monthly difference |
|---|---|---|---|---|---|---|
| Carlton | Inner Melbourne | $378 | $373,813 | $1,172 | $1,639 | -$467 |
| Hastings | Mornington Peninsula |
$385 | $418,576 | $1,313 | $1,669 | -$356 |
| Craigieburn | North West Melb. |
$359 | $402,480 | $1,262 | $1,554 | -$292 |
| Cranbourne | South East Melb. |
$345 | $393,408 | $1,234 | $1,497 | -$263 |
| Sydenham | West Melbourne | $370 | $435,934 | $1,367 | $1,605 | -$238 |
| Dandenong | South East Melb. |
$343 | $399,609 | $1,253 | $1,487 | -$233 |
| Sunbury | North West Melb. |
$361 | $427,042 | $1,339 | $1,564 | -$224 |
| Melbourne | Inner Melbourne | $397 | $479,379 | $1,503 | $1,720 | -$216 |
| Werribee | West Melbourne | $330 | $390,608 | $1,225 | $1,430 | -$205 |
| Abbotsford | Inner Melbourne | $449 | $556,499 | $1,745 | $1,946 | -$201 |
Source: CoreLogic. Details on assumptions can be found here (or under the Greater Brisbane Houses table displayed above).
Greater Hobart
Only three suburbs made the unit list in Hobart – Glenorchy, Kingston and Sandy Bay. There are more options when it comes to houses. In Risdon Vale, for example, the monthly difference between repayments and rent is $773.
Greater Hobart Houses
← Mobile/tablet users, scroll sideways to view full table →
| Suburb | SA4 Region | Median rent |
Median value |
Monthly payments |
Monthly rent |
Monthly difference |
|---|---|---|---|---|---|---|
| Risdon Vale | Hobart | $439 | $359,738 | $1,128 | $1,901 | -$773 |
| Rokeby | Hobart | $480 | $420,627 | $1,319 | $2,078 | -$759 |
| New Norfolk | Hobart | $421 | $354,072 | $1,110 | $1,825 | -$715 |
| Glenorchy | Hobart | $474 | $435,326 | $1,365 | $2,053 | -$688 |
| Bridgewater | Hobart | $434 | $381,179 | $1,195 | $1,881 | -$685 |
| Claremont | Hobart | $456 | $428,845 | $1,345 | $1,976 | -$631 |
| West Moonah | Hobart | $485 | $512,276 | $1,607 | $2,102 | -$495 |
| Dodges Ferry | Hobart | $438 | $458,527 | $1,438 | $1,896 | -$458 |
| Midway Point | Hobart | $452 | $496,021 | $1,556 | $1,958 | -$403 |
| Lenah Valley | Hobart | $558 | $660,422 | $2,071 | $2,417 | -$346 |
Greater Hobart Units
← Mobile/tablet users, scroll sideways to view full table →
| Suburb | SA4 Region | Median rent |
Median value |
Monthly payments |
Monthly rent |
Monthly difference |
|---|---|---|---|---|---|---|
| Glenorchy | Hobart | $388 | $372,078 | $1,167 | $1,683 | -$516 |
| Kingston | Hobart | $420 | $465,198 | $1,459 | $1,821 | -$362 |
| Sandy Bay | Hobart | $485 | $580,480 | $1,820 | $2,101 | -$281 |
Source: CoreLogic. Details on assumptions can be found here (or under the Greater Brisbane Houses table displayed above).
Greater Adelaide
Top of the list in Adelaide are houses in Elizabeth Park where the monthly difference between repayments and rent is $665. Units in Mawson Lakes are close behind with a monthly difference of $663.
Greater Adelaide Houses
← Mobile/tablet users, scroll sideways to view full table →
| Suburb | SA4 Region | Median rent | Median value |
Monthly payments |
Monthly rent |
Monthly difference |
|---|---|---|---|---|---|---|
| Elizabeth North | Adelaide North | $291 | $190,873 | $599 | $1,263 | -$665 |
| Christie Downs | Adelaide South | $373 | $305,502 | $958 | $1,615 | -$657 |
| Elizabeth Downs | Adelaide North | $301 | $206,488 | $648 | $1,303 | -$656 |
| Salisbury North | Adelaide North | $345 | $271,211 | $851 | $1,495 | -$645 |
| Sellicks Beach | Adelaide South | $460 | $429,892 | $1,348 | $1,993 | -$645 |
| Huntfield Heights | Adelaide South | $371 | $310,334 | $973 | $1,606 | -$633 |
| Davoren Park | Adelaide North | $291 | $202,951 | $636 | $1,262 | -$626 |
| Elizabeth Park | Adelaide North | $310 | $229,705 | $720 | $1,345 | -$624 |
| Morphett Vale | Adelaide South | $384 | $338,345 | $1,061 | $1,662 | -$601 |
| Elizabeth East | Adelaide North | $314 | $243,504 | $764 | $1,362 | -$599 |
Source: CoreLogic. Details on assumptions can be found here (or under the Greater Brisbane Houses table displayed above).
Greater Adelaide Units
← Mobile/tablet users, scroll sideways to view full table →
| Suburb | SA4 Region | Median rent |
Median value |
Monthly payments |
Monthly rent |
Monthly difference |
|---|---|---|---|---|---|---|
| Mawson Lakes | Adelaide North | $357 | $282,116 | $885 | $1,547 | -$663 |
| Adelaide | Adelaide Central & Hills |
$450 | $416,408 | $1,306 | $1,948 | -$642 |
| Mount Barker | Adelaide Central & Hills |
$344 | $272,778 | $855 | $1,492 | -$637 |
| Salisbury | Adelaide North | $290 | $203,654 | $639 | $1,257 | -$618 |
| Plympton | Adelaide West | $329 | $285,109 | $894 | $1,426 | -$532 |
| Bowden | Adelaide West | $421 | $417,357 | $1,309 | $1,825 | -$516 |
| Prospect | Adelaide Central & Hills |
$376 | $359,269 | $1,127 | $1,630 | -$504 |
| Morphett Vale | Adelaide South | $304 | $261,933 | $821 | $1,318 | -$497 |
| Lightsview | Adelaide North | $385 | $375,109 | $1,176 | $1,668 | -$491 |
| Seaton | Adelaide West | $351 | $337,647 | $1,059 | $1,520 | -$461 |
Source: CoreLogic. Details on assumptions can be found here (or under the Greater Brisbane Houses table displayed above).
Greater Perth
As well as suburbs in Perth there are a few locations in the Mandurah region where it may be cheaper to buy than rent. For example, the monthly difference between repayments and rent for a house in Greenfields is $669.
Greater Perth Houses
← Mobile/tablet users, scroll sideways to view full table →
| Suburb | SA4 Region | Median rent |
Median value |
Monthly payments |
Monthly rent |
Monthly difference |
|---|---|---|---|---|---|---|
| Cooloongup | Perth South West |
$384 | $291,748 | $915 | $1,664 | -$749 |
| Camillo | Perth South East |
$360 | $278,884 | $875 | $1,559 | -$685 |
| Parmelia | Perth South West |
$355 | $274,490 | $861 | $1,540 | -$679 |
| Greenfields | Mandurah | $376 | $305,676 | $959 | $1,628 | -$669 |
| Girrawheen | Perth North West |
$385 | $318,815 | $1,000 | $1,669 | -$669 |
| Mandurah | Mandurah | $362 | $298,699 | $937 | $1,571 | -$634 |
| Aveley | Perth North East |
$472 | $451,521 | $1,416 | $2,046 | -$630 |
| Ridgewood | Perth North West |
$434 | $400,272 | $1,255 | $1,883 | -$628 |
| Armadale | Perth South East |
$337 | $269,395 | $845 | $1,459 | -$614 |
| Clarkson | Perth North West |
$437 | $410,004 | $1,286 | $1,895 | -$609 |
Source: CoreLogic. Details on assumptions can be found here (or under the Greater Brisbane Houses table displayed above).
Greater Perth Units
← Mobile/tablet users, scroll sideways to view full table →
| Suburb | SA4 Region | Median rent |
Median value |
Monthly payments |
Monthly rent |
Monthly difference |
|---|---|---|---|---|---|---|
| Cloverdale | Perth South East |
$382 | $294,193 | $923 | $1,655 | -$732 |
| Victoria Park | Perth South East |
$383 | $311,061 | $976 | $1,660 | -$684 |
| Perth | Perth Inner | $467 | $427,543 | $1,341 | $2,024 | -$683 |
| Wembley | Perth Inner | $351 | $274,450 | $861 | $1,520 | -$659 |
| Mandurah | Mandurah | $352 | $276,815 | $868 | $1,523 | -$655 |
| Rivervale | Perth South East |
$400 | $343,611 | $1,078 | $1,732 | -$654 |
| West Perth | Perth Inner | $473 | $450,093 | $1,412 | $2,052 | -$640 |
| East Perth | Perth Inner | $497 | $485,173 | $1,522 | $2,153 | -$631 |
| Joondalup | Perth North West |
$398 | $350,102 | $1,098 | $1,724 | -$626 |
| Tuart Hill | Perth North West |
$367 | $318,752 | $1,000 | $1,589 | -$590 |
Source: CoreLogic. Details on assumptions can be found here (or under the Greater Brisbane Houses table displayed above).
Greater Darwin
There’s not a lot of choice in Darwin with only four suburbs making the list – two for houses and two for units – but the difference between repayments and rent in these areas is quite substantial. For example, in Leanyer the monthly difference between repayments and rent for a house is $858.
Greater Darwin Houses
← Mobile/tablet users, scroll sideways to view full table →
| Suburb | SA4 Region | Median rent |
Median value |
Monthly payments |
Monthly rent |
Monthly difference |
|---|---|---|---|---|---|---|
| Leanyer | Darwin | $596 | $549,354 | $1,723 | $2,581 | -$858 |
| Durack | Darwin | $569 | $562,221 | $1,763 | $2,467 | -$704 |
Source: CoreLogic. Details on assumptions can be found here (or under the Greater Brisbane Houses table displayed above).
Greater Darwin Units
← Mobile/tablet users, scroll sideways to view full table →
| Suburb | SA4 Region | Median rent |
Median value |
Monthly payments |
Monthly rent |
Monthly difference |
|---|---|---|---|---|---|---|
| Darwin | Darwin | $523 | $379,000 | $1,189 | $2,266 | -$1,078 |
| Stuart Park | Darwin | $492 | $388,428 | $1,218 | $2,132 | -$914 |
Cover image source: Jandrie Lombard/Shutterstock.com

This article was reviewed by our Editor-at-Large Effie Zahos before it was updated, as part of our fact-checking process.


 Owner occupied
10% min deposit
Redraw facility
Owner occupied
10% min deposit
Redraw facility
Try our Home Loans comparison tool to instantly compare Canstar expert rated options.


