The Australian share market closed lower last week, as falls across the energy and mining sectors overpowered the big four banks’ gains.
Over the course of last week, the benchmark S&P/ASX 200 and the All Ordinaries were down 0.24% and 0.49% at 5,716 points and 5,793 points, respectively.
Three heavyweight sectors were in the red last week with energy down 3.76%, telecommunications down 2.57% and materials down 2.40%, while the smaller information technology sector declined 7.94%.
Canstar’s General Manager of Wealth Josh Callaghan said sharp declines in oil prices hurt the energy sector, while technology stocks experienced the heat of changing investor mindsets.
“The technology sector took a slap from the market, with Afterpay and Xero feeling the brunt of it as investors across the globe reined in their growth expectations of high-flying tech stocks,” Mr Callaghan said.
Payment technology company Afterpay saw its share price drop 12.4% over the course of last week.
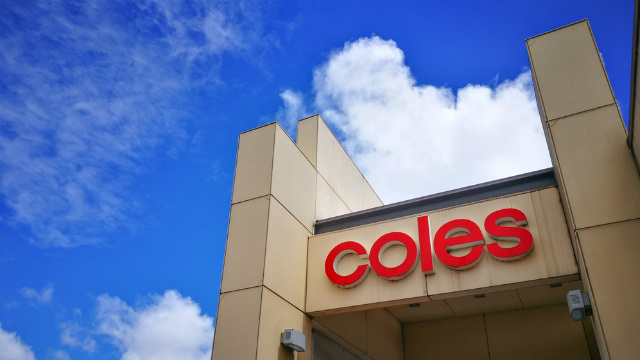
Another stock that didn’t do so well was Wesfarmers as its share price adjusted to no longer having Coles supermarkets as part of its business following the demerger.
Wesfarmers’ share price fell by 28.2% with more than $14.1 billion wiped from its market value.
Coles floated on the share market last Wednesday with its shares closing at $12.75 last week.
ASX 200 Listed Companies – Top 5 Biggest Share Price Gains and Losses (16/11/2018 to 23/11/2018) | |||||||
Biggest Gains | Biggest Losses | ||||||
Rank | Company | Closing Share Price | % Change | Rank | Company | Closing Share Price | % Change |
1 | Trade Me Group (TME) | $5.62 | 18.6% | 1 | Wesfarmers (WES) | $31.89 | -28.2% |
2 | Mineral Resources (MIN) | $15.48 | 15.6% | 2 | CYBG (CYB) | $3.41 | -24.2% |
3 | Saracen Mineral Holdings (SAR) | $2.58 | 5.3% | 3 | Fletcher Building (FBU) | $4.40 | -17.0% |
4 | Carsales.com (CAR) | $11.90 | 4.9% | 4 | Bravura Solution (BVS) | $3.84 | -13.1% |
5 | Sonic Healthcare (SHL) | $22.91 | 4.7% | 5 | Afterpay Touch Group (APT) | $11.29 | -12.4% |
Prepared by Canstar. Prices taken as of week to week close. |
Last Monday saw the start of the seventh and final round of the royal commission’s hearings into financial misconduct, where Commonwealth Bank and Westpac chief executives were among those to take the stand.
Despite this, the big four banks were among the best performers last week.
CBA’s shares closed 3.5% higher, Westpac’s were up 3%, ANZ shares gained 3.9% and National Australia Bank rose 3%.
ANZ and NAB executives and leaders are due to appear before the commission this week in Melbourne.
ASX 200 Listed Companies – Top 5 Biggest Market Cap Gains and Losses (16/11/2018 to 23/11/2018) | |||||||||
Biggest Gains | Biggest Losses | ||||||||
Rank | Company | $ Change in Market Cap | Closing Share Price | % Change in Share Price | Rank | Company | $ Change in Market Cap | Closing Share Price | % Change in Share Price |
1 | Commonwealth Bank of Australia (CBA) | $4,248,574,817 | $71.30 | 3.5% | 1 | Wesfarmers (WES) | -$14,173,003,025 | $31.89 | -28.2% |
2 | Australia and New Zealand Banking Group (ANZ) | $2,663,505,456 | $26.34 | 3.9% | 2 | RIO Tinto (RIO) | -$4,206,601,029 | $76.78 | -3.2% |
3 | Westpac Banking Corp (WBC) | $2,644,793,467 | $26.04 | 3.0% | 3 | BHP Billiton (BHP) | -$2,601,469,795 | $31.55 | -2.5% |
4 | National Australia Bank (NAB) | $1,941,304,618 | $24.48 | 3.0% | 4 | Macquarie Group (MQG) | -$1,521,510,839 | $114.53 | -3.8% |
5 | Goodman Group (GMG) | $816,246,898 | $10.70 | 4.4% | 5 | Telstra Corporation (TLS) | -$1,427,195,742 | $2.92 | -3.9% |
Prepared by Canstar. Prices taken as of week to week close. |
Try our Online Share Trading comparison tool to instantly compare Canstar expert rated options.
This advice is general and has not taken into account your objectives, financial situation, or needs. It is not personal advice. Consider whether this advice is right for you, having regard to your own objectives, financial situation and needs. You may need financial advice from a suitably qualified adviser. For more information, read Canstar’s Financial Services and Credit Guide (FSCG) and our detailed disclosure. Canstar may receive a fee for referring you to a product provider – for further information, see how we get paid. Payment of fees for ads does not influence our Star Ratings or Awards.
Canstar is a comparison website, not a product issuer, so it’s important to check any product information directly with the provider. Consider the Product Disclosure Statement (PDS), Target Market Determination (TMD) and other applicable product documentation before making a decision to purchase, acquire, invest in or apply for a financial or credit product. Contact the product issuer directly for a copy of the PDS, TMD and other documentation.
Canstar is an information provider and in giving you product information Canstar is not making any suggestion or recommendation about a particular credit product or loan. If you decide to apply for a credit product or loan, you will deal directly with a credit provider, and not with Canstar. Rates and product information should be confirmed with the relevant credit provider. For more information, read the credit provider’s key facts sheet and other applicable loan documentation for that product. Read the Comparison Rate Warning.
All information about performance returns is historical. Past performance should not be relied upon as an indicator of future performance; unit prices and the value of your investment may fall or rise.
Canstar is an information provider and in giving you product information Canstar is not making any suggestion or recommendation about a particular product. The information has been prepared without taking into account your individual investment objectives, financial circumstances or needs. Before you decide whether or not to acquire a particular financial product you should assess whether it is appropriate for you in the light of your own personal circumstances, having regard to your own objectives, financial situation and needs. You may wish to obtain financial advice from a suitably qualified adviser before making any decision to acquire a financial product. Please refer to the product disclosure statement (PDS) and Canstar’s Financial Services and Credit Guide (FSCG) for more information, and read our detailed disclosure, important notes and liability disclaimer.
All information about performance returns is historical. Past performance should not be relied upon as an indicator of future performance; unit prices and the value of your investment may fall or rise.
Canstar may earn a fee for referrals from its website tables, and from Sponsorship or Promotion of certain products. Fees payable by product providers for referrals and Sponsorship or Promotion may vary between providers, website position, and revenue model. Sponsorship or Promotion fees may be higher than referral fees. Sponsored or Promotion products are clearly disclosed as such on website pages. They may appear in a number of areas of the website such as in comparison tables, on hub pages and in articles. Sponsored or Promotion products may be displayed in a fixed position in a table, regardless of the product's rating, price or other attributes. The table position of a Sponsored or Promoted product does not indicate any ranking or rating by Canstar. For more information please see How We Get Paid.
Any advice provided on this website is general and has not taken into account your objectives, financial situation or needs. Consider whether this advice is right for you. Consider the Product Disclosure Statement and Target Market Determination before making a purchase decision. Canstar provides an information service. It is not a credit provider, and in giving you information about credit products Canstar is not making any suggestion or recommendation to you about a particular credit product. Research provided by Canstar Research AFSL and Australian Credit Licence No. 437917. You must not reproduce, transmit, disseminate, sell, or publish information on this website without prior written permission from Canstar.