If you’ve made the decision to diversify your portfolio and invest overseas, the next thing you may want to consider is which country to invest in. To help you out, we’ve taken a look at how the equity markets across the G20 countries have performed in the past year.
The G20 countries are a group of the world’s largest economies and collectively they represent roughly two-thirds of the global population, 85% of global GDP and over 75% of global trade. So, that’s the big reason why we have focused on G20 countries. There are also 195 countries in the world, so we had to narrow it down somehow.
The G20’s membership base is a mix of advanced and emerging economies. For those unfamiliar with these terms, an advanced economy is a nation with a high level of GDP per capita and typically a significant level of industrialisation. An emerging economy, on the other hand, is a country that is progressing towards become an advanced economy. Generally, emerging market companies and economies have the potential to expand at a faster rate than companies in advanced nations.
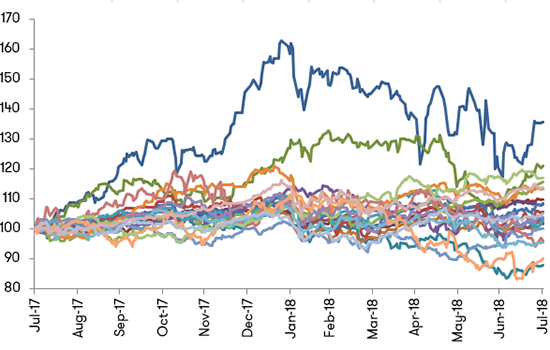
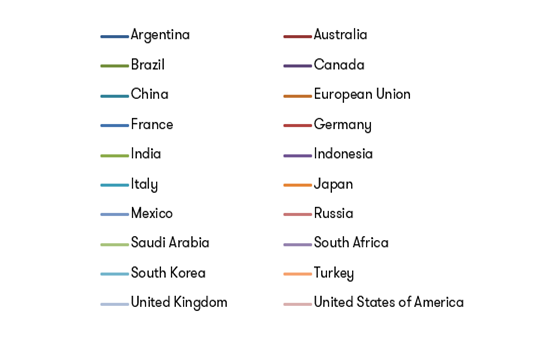
In the past 12 months, G20 countries have delivered average nominal returns of 6.7% across key equity benchmark indices. From the graph below you can see Argentina (dark blue line) topped the performance list with a seemingly impressive 35.7% return. However, this is largely a reflection of the country’s current inflation crisis, which recently hit an annualised rate of 29.5%. In nominal terms, the top three equity markets were in emerging economies including: Argentina, Brazil and Saudi Arabia.
Although, when adjusted for inflation, emerging markets still remained at the top of the pack. Brazil delivered an inflation-adjusted equity return of 14.5% in the past year. The country seems to be making a comeback after years of recession. Saudi Arabia followed Brazil with a return of 14.5%, largely due to the kingdom’s major reforms and a jump in crude oil prices.
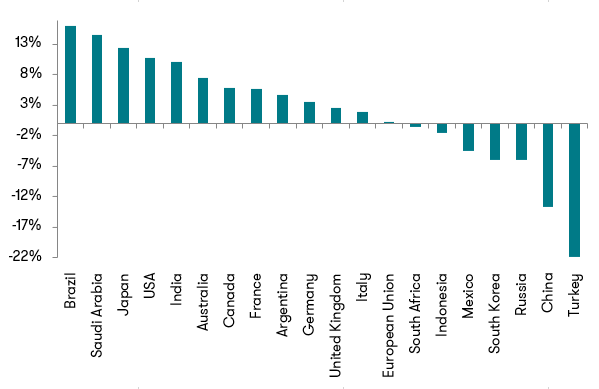
1. Brazil 16.1% | 6. Australia 7.5% | 11. United Kingdom 2.6% | 16. Mexico -4.4% |
---|---|---|---|
2. Saudi Arabia 14.5% | 7. Canada 5.9% | 12. Italy 1.9% | 17. South Korea -5.9% |
3. Japan 12.4% | 8. France 5.8% | 13. European Union 0.2% | 18. Russia -5.9% |
4. USA 10.8% | 9. Argentina 4.8% | 14. South Africa -0.5% | 19. China -13.8% |
5. India 10.2% | 10. Germany 3.6% | 15. Indonesia -1.5% | 20. Turkey -21.9% |
Prepared by Canstar
With inflation adjusted, Australia’s market was the 6th best performing G20 equity market. The ASX 200 was up and it saw returns of 7.5% over the past year. This is ahead of all other advanced economies, excluding Japan and the USA. A relatively strong performance in the domestic equity market may have been the result of a continued rebound in commodity prices and a depreciating Australian dollar.
Looking back on a country’s equity returns can be useful, as it might provide an idea of what to expect from your investment. However, it is only one side of the story. When mapping out your next overseas investment, it’s worth investigating not only the company you’re looking to invest in, but also the country’s current economic and political climate. Doing your research is key, and you can start by checking out our article of the risks and benefits of investing overseas. If ever in doubt, seek professional financial advice.
Want articles like this delivered straight to your inbox? Sign up to our newsletter below.
Try our Investor Hub comparison tool to instantly compare Canstar expert rated options.
This advice is general and has not taken into account your objectives, financial situation, or needs. It is not personal advice. Consider whether this advice is right for you, having regard to your own objectives, financial situation and needs. You may need financial advice from a suitably qualified adviser. For more information, read Canstar’s Financial Services and Credit Guide (FSCG) and our detailed disclosure. Canstar may receive a fee for referring you to a product provider – for further information, see how we get paid. Payment of fees for ads does not influence our Star Ratings or Awards.
Canstar is a comparison website, not a product issuer, so it’s important to check any product information directly with the provider. Consider the Product Disclosure Statement (PDS), Target Market Determination (TMD) and other applicable product documentation before making a decision to purchase, acquire, invest in or apply for a financial or credit product. Contact the product issuer directly for a copy of the PDS, TMD and other documentation.
Canstar is an information provider and in giving you product information Canstar is not making any suggestion or recommendation about a particular credit product or loan. If you decide to apply for a credit product or loan, you will deal directly with a credit provider, and not with Canstar. Rates and product information should be confirmed with the relevant credit provider. For more information, read the credit provider’s key facts sheet and other applicable loan documentation for that product. Read the Comparison Rate Warning.
All information about performance returns is historical. Past performance should not be relied upon as an indicator of future performance; unit prices and the value of your investment may fall or rise.
Canstar is an information provider and in giving you product information Canstar is not making any suggestion or recommendation about a particular product. The information has been prepared without taking into account your individual investment objectives, financial circumstances or needs. Before you decide whether or not to acquire a particular financial product you should assess whether it is appropriate for you in the light of your own personal circumstances, having regard to your own objectives, financial situation and needs. You may wish to obtain financial advice from a suitably qualified adviser before making any decision to acquire a financial product. Please refer to the product disclosure statement (PDS) and Canstar’s Financial Services and Credit Guide (FSCG) for more information, and read our detailed disclosure, important notes and liability disclaimer.
All information about performance returns is historical. Past performance should not be relied upon as an indicator of future performance; unit prices and the value of your investment may fall or rise.
Canstar may earn a fee for referrals from its website tables, and from Sponsorship or Promotion of certain products. Fees payable by product providers for referrals and Sponsorship or Promotion may vary between providers, website position, and revenue model. Sponsorship or Promotion fees may be higher than referral fees. Sponsored or Promotion products are clearly disclosed as such on website pages. They may appear in a number of areas of the website such as in comparison tables, on hub pages and in articles. Sponsored or Promotion products may be displayed in a fixed position in a table, regardless of the product's rating, price or other attributes. The table position of a Sponsored or Promoted product does not indicate any ranking or rating by Canstar. For more information please see How We Get Paid.
Any advice provided on this website is general and has not taken into account your objectives, financial situation or needs. Consider whether this advice is right for you. Consider the Product Disclosure Statement and Target Market Determination before making a purchase decision. Canstar provides an information service. It is not a credit provider, and in giving you information about credit products Canstar is not making any suggestion or recommendation to you about a particular credit product. Research provided by Canstar Research AFSL and Australian Credit Licence No. 437917. You must not reproduce, transmit, disseminate, sell, or publish information on this website without prior written permission from Canstar.