5 best suburbs in Regional Western Australia to invest in 2025
Looking to buy a property in Western Australia? These are the 5 best suburbs in regional WA to invest in for 2025, based on overall market performance.
Looking to buy a property in Western Australia? These are the 5 best suburbs in regional WA to invest in for 2025, based on overall market performance.
KEY POINTS
- Similarly to Perth, property markets in Regional WA may be starting to descend from the peak of the last few years.
- Sales activity has reportedly declined in the key locations which have had recent price booms.
- Regional WA’s top locations are those where sales activity is consistent or still rising and the other performance indicators are also positive.
Regional Western Australia (WA) has been experiencing similar trends in its property markets to those seen in Perth. After price growth well above national averages in the past two years, Regional WA is showing signs of having reached a peak in the current cycle. This is particularly true for the most popular targets Bunbury, Mandurah and Geraldton.
Regional WA has good results on rental growth and short-term price growth, but it’s weak in other areas.
The difficulty when nominating places to buy in Regional WA is that so many of the key locations have experienced extraordinary price growth in the past one or two years, with evidence that these markets have peaked, thanks to sales activity now falling. Some of the top locations are those where sales activity is consistent or still rising and the other performance indicators are also positive.
The data below was prepared in February 2025 with suburb median prices, growth rates, vacancy rates and median rental yields provided by Hotspotting by Ryder and initial outlay and monthly repayments calculated by Canstar Research.
Top 5 best suburbs in Regional Western Australia to invest in 2025
- Bayonet Head
- Bluff Point
- Bunbury (Unit)
- Capel
- Erskine
Bayonet Head
Despite significant media attention on booming markets like Bunbury, Mandurah and Geraldton, there’s been little focus on Albany on the southern tip of WA. A port city of 35,000 residents, this regional town has been a quiet achiever, showcasing steady price growth in recent years. The bayside enclave of Bayonet Head has averaged 10% a year over the past five years, including 17% in 2024. Vacancies are below 1% and rents up 9% in the past year.
Bluff Point
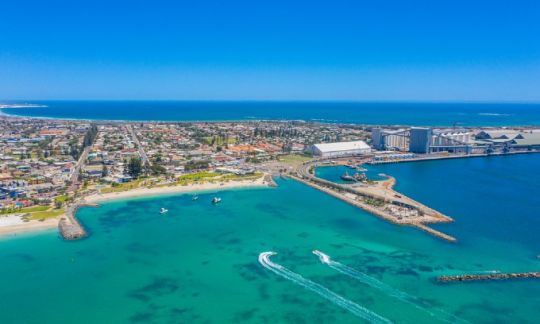
Geraldton, the largest city north of Perth, is economically significant for its export port and links to the resources sector. It also offers an affordable coastal lifestyle and has captured the attention of investors. Some parts of this market have had major uplift but the beachside suburb of Bluff Point has been relatively muted, up 10% in 2024, but with consistent buyer demand, further growth is expected. And with vacancies at zero, rents have boomed.
Bunbury (U)
WA’s largest regional city has a strong economy and an important export port, and the central suburb of Bunbury has experienced consistent buyer demand. Downtown Bunbury has many lifestyle features, including multiple water frontages. House prices rose 20% in 2024 and the median is now above $800,000 but units are in the $400,000s. Vacancies are 0.5%, with unit rents up 14% in the past year, and yields are above 6%.
Capel
While Bunbury and Busselton have both had recent surges in property values, Capel, situated halfway between the two regional centres, is catching the wave—with its median house price up 24% in 12 months and a five-year growth rate averaging 13% a year. The town itself, located on the Capel River alongside Peppermint Grove Beach and Tuart Forest National Park, taps into an outdoor lifestyle. With vacancies low, rents rose 13% in the past year.
Erskine
Mandurah, the popular water-based community south of greater Perth (and well-connected by rail and freeway), has been the star performer of Regional WA. It continues to attract strong buyer demand and sales activity is still rising in the suburb of Erskine, where the median house price rose 26% in the past year. This centrally located suburb on the Peel Inset has the Len Howard Conservation Park overlooking Collins Pool.

 Owner occupied
20% min deposit
Redraw facility
Owner occupied
20% min deposit
Redraw facility


Best suburbs in Regional Western Australia to invest in 2025
← Mobile/tablet users, scroll sideways to view full table →
| Suburb | Median price |
1-year growth (p.a %) |
10-yr average annual growth (p.a %) |
Vacancy Rate |
Median Rental Yield (p.a %) |
Initial outlay (no concessions) on 20% deposit |
Monthly Repayment |
|---|---|---|---|---|---|---|---|
| Bayonet Head |
$590,000 | 17% | 10% | 0.70% | 5.00% | $140,571 | $2,891 |
| Bluff Point | $460,000 | 10% | 6% | 0.00% | 5.20% | $108,376 | $2,254 |
| Bunbury (Unit) |
$450,000 | 5% | 8% | 0.50% | 6.30% | $105,901 | $2,205 |
| Capel | $560,000 | 24% | 13% | 1.40% | 5.70% | $133,146 | $2,744 |
| Erskine | $695,000 | 26% | 11% | 0.40% | 4.70% | $166,579 | $3,405 |
Source: www.canstar.com.au. Prepared in February 2025. Based on a selection of suburbs’ median prices, growth and rent figures provided by Hotspotting by Ryder. Initial outlay figures include the deposit, stamp duty, mortgage registration and transfer fees; and lenders’ mortgage insurance (LMI) premium for the 10% deposit scenarios. Stamp duty calculated based on an owner occupier purchase of an established dwelling where applicable. FHB concessions include stamp duty only. LMI premium based on Helia LMI Premium Calculator for an owner occupier borrower and a loan term of 30 years. Monthly repayments calculated based on the interest rates of 6.20% (20% deposit) and 6.34% (10% deposit) and a loan term of 30 years. Interest rates based on the RBA Lenders’ Interest Rates (November 2024). Percentage of income based on the average total income by Greater Capital City Statistical Area (ABS Personal Income, 2021-22), adjusted by the ABS Wage Price Index (Sep-2024) for each state.
What are some of the factors that are affecting the Regional Western Australia market?
Sales volumes
This is the weakest category for Regional WA, with sales activity declining in the key locations which have had recent price booms. Only 20% of locations have positive trends with buyer activity.
Quarterly price growth
The recent weakness in sales activity has not yet flowed through fully to price performance and 64% of locations recorded median price growth above the benchmark level in the review quarter.
Vacancy rates
There has been a notable change in Regional WA’s vacancy rates. Last year, 84% of locations had vacancy rates below the benchmark level, but now only 45% of locations are below 1%.
Rental growth
Rents in Regional WA remain strong, with the gradual change in the vacancy rate yet to be fully reflected in rental prices. Over 80% of locations have had annual rental growth above 5%.
Infrastructure spending
Investment in infrastructure continues to focus on key regional cities such as Bunbury, Geraldton and Mandurah, as well as infrastructure to support the state’s nation-leading resources sector, though not as strongly as other jurisdictions.
 Owner occupied
20% min deposit
Redraw facility
Owner occupied
10% min deposit
Redraw facility
Owner occupied
50% min deposit
Redraw facility
Owner occupied
20% min deposit
Redraw facility
Owner occupied
30% min deposit
Redraw facility
Owner occupied
20% min deposit
Redraw facility
Owner occupied
10% min deposit
Redraw facility
Owner occupied
50% min deposit
Redraw facility
Owner occupied
20% min deposit
Redraw facility
Owner occupied
30% min deposit
Redraw facility
Cover image source: trabantos/Shutterstock.com

This article was reviewed by our Finance Editor Jessica Pridmore before it was updated, as part of our fact-checking process.
 Owner occupied
30% min deposit
Redraw facility
Owner occupied
30% min deposit
Redraw facility
Try our Home Loans comparison tool to instantly compare Canstar expert rated options.


