ASX 200 weekly wrap: Westpac, ANZ CBA, BHP lead losses
The Australian share market closed lower last week with three of the big four banks, major miner BHP Billiton and Coles’ owner Wesfarmers among the worst performers.

The benchmark S&P/ASX 200 and the All Ordinaries shed more than 3% over the course of last week to finish at 5,730 points and 5,822 points, respectively.
A renewed sell-off across the banks drove the financials sector down 4.7%.
There was broad sector weakness with the consumer staples, healthcare and mining-related materials sectors each falling by more than 3%, while a tumble in oil prices sent energy stocks lower.
About $8.4 billion was wiped from Westpac’s market value, $5.1 billion from ANZ’s and $3.6 billion from Commonwealth Bank’s, to rank them among the worst performers in terms of market capitalisation last week.
Canstar’s General Manager of Wealth Josh Callaghan said the market could not recover from three big session drops earlier in the week.
He said the week’s biggest market cap losses’ list read almost like the prior week’s winners’ list where Westpac, ANZ and Commonwealth Bank led market value gains.
“We know from share trading data that the big four banks, the big two miners and the supermarkets are the most commonly traded stocks in Australia and it seems that the market is in a tussle to determine their market value, driving the stock prices higher and lower,” Mr Callaghan said.
“The latest rounds of the royal commission certainly won’t provide bank investors with any comfort as the CEOs from each of the banks and the two major regulators are due to front Commissioner Kenneth Hayne this week.”
| ASX 200 Listed Companies – Top 5 Biggest Market Cap Gains and Losses (09/11/2018 to 16/11/2018) | |||||||||
| Biggest Gains | Biggest Losses | ||||||||
| Rank | Company | $ Change in Market Cap | Closing Share Price | % Change in Share Price | Rank | Company | $ Change in Market Cap | Closing Share Price | % Change in Share Price |
| 1 | Worleyparsons (WOR) | $948,443,357 | $14.92 | -2.0% | 1 | Westpac (WBC) | -$8,346,556,008 | $25.27 | -8.8% |
| 2 | AGL Energy (AGL) | $432,844,528 | $18.56 | 3.7% | 2 | ANZ (ANZ) | -$5,086,304,069 | $25.36 | -6.5% |
| 3 | Healthscope (HSO) | $417,878,830 | $2.32 | 11.5% | 3 | Commonwealth Bank (CBA) | -$3,628,990,990 | $68.90 | -2.9% |
| 4 | Spark New Zealand (SPK) | $257,173,799 | $3.94 | 3.7% | 4 | Wesfarmers (WES) | -$3,435,535,934 | $44.39 | -6.4% |
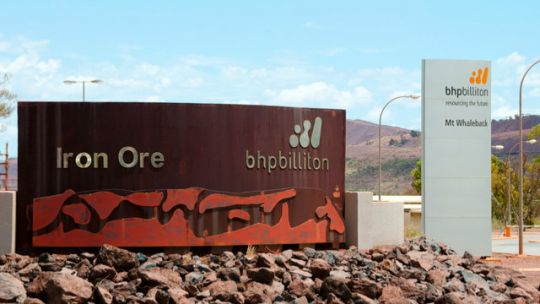
| 5 | G8 Education (GEM) | $218,582,315 | $2.84 | 20.3% | 5 | BHP Billiton (BHP) | -$3,372,275,660 | $32.36 | -3.1% |
| Prepared by Canstar. Prices taken as of week to week close. | |||||||||
Mr Callaghan said the only sector to buck the downward trend was utilities with the likes of AGL Energy posting the biggest gains, in terms of market cap.
“This may indicate a flight to safety for some investors as utilities are often seen as defensive due to their boom-bust cycle being largely uncorrelated with the wider business cycle,” he said.
| ASX 200 Listed Companies – Top 5 Biggest Share Price Gains and Losses (09/11/2018 to 16/11/2018) | |||||||
| Biggest Gains | Biggest Losses | ||||||
| Rank | Company | Closing Share Price | % Change | Rank | Company | Closing Share Price | % Change |
| 1 | G8 Education (GEM) | $2.84 | 20.3% | 1 | Aveo (AOG) | $1.62 | -13.1% |
| 2 | Appen (APX) | $12.98 | 11.9% | 2 | Mineral Resources (MIN) | $13.39 | -11.7% |
| 3 | Healthscope (HSO) | $2.32 | 11.5% | 3 | Syrah Resources (SYR) | $1.73 | -10.8% |
| 4 | Corporate Travel Management (CTD) | $22.76 | 8.3% | 4 | Steadfast Group (SDF) | $2.75 | -10.4% |
| 5 | Orocobre (ORE) | $4.65 | 6.7% | 5 | Bapcor (BAP) | $6.28 | -10.0% |
| Prepared by Canstar. Prices taken as of week to week close. | |||||||
Coles and Bunnings owner Wesfarmers’ shares were down 6.4%, wiping $3.4 billion from its market value.
This comes after the Perth conglomerate’s shareholders approved the demerger of Coles supermarkets from the wider Wesfarmers business.
Topping last week’s share price gains was childcare operator G8 Education.
Shares in G8 soared by more than 20% to $2.84, after the company revealed a better outlook than the market had expected, including plans to sell up to eight loss-making childcare centres.

Try our Online Share Trading comparison tool to instantly compare Canstar expert rated options.