





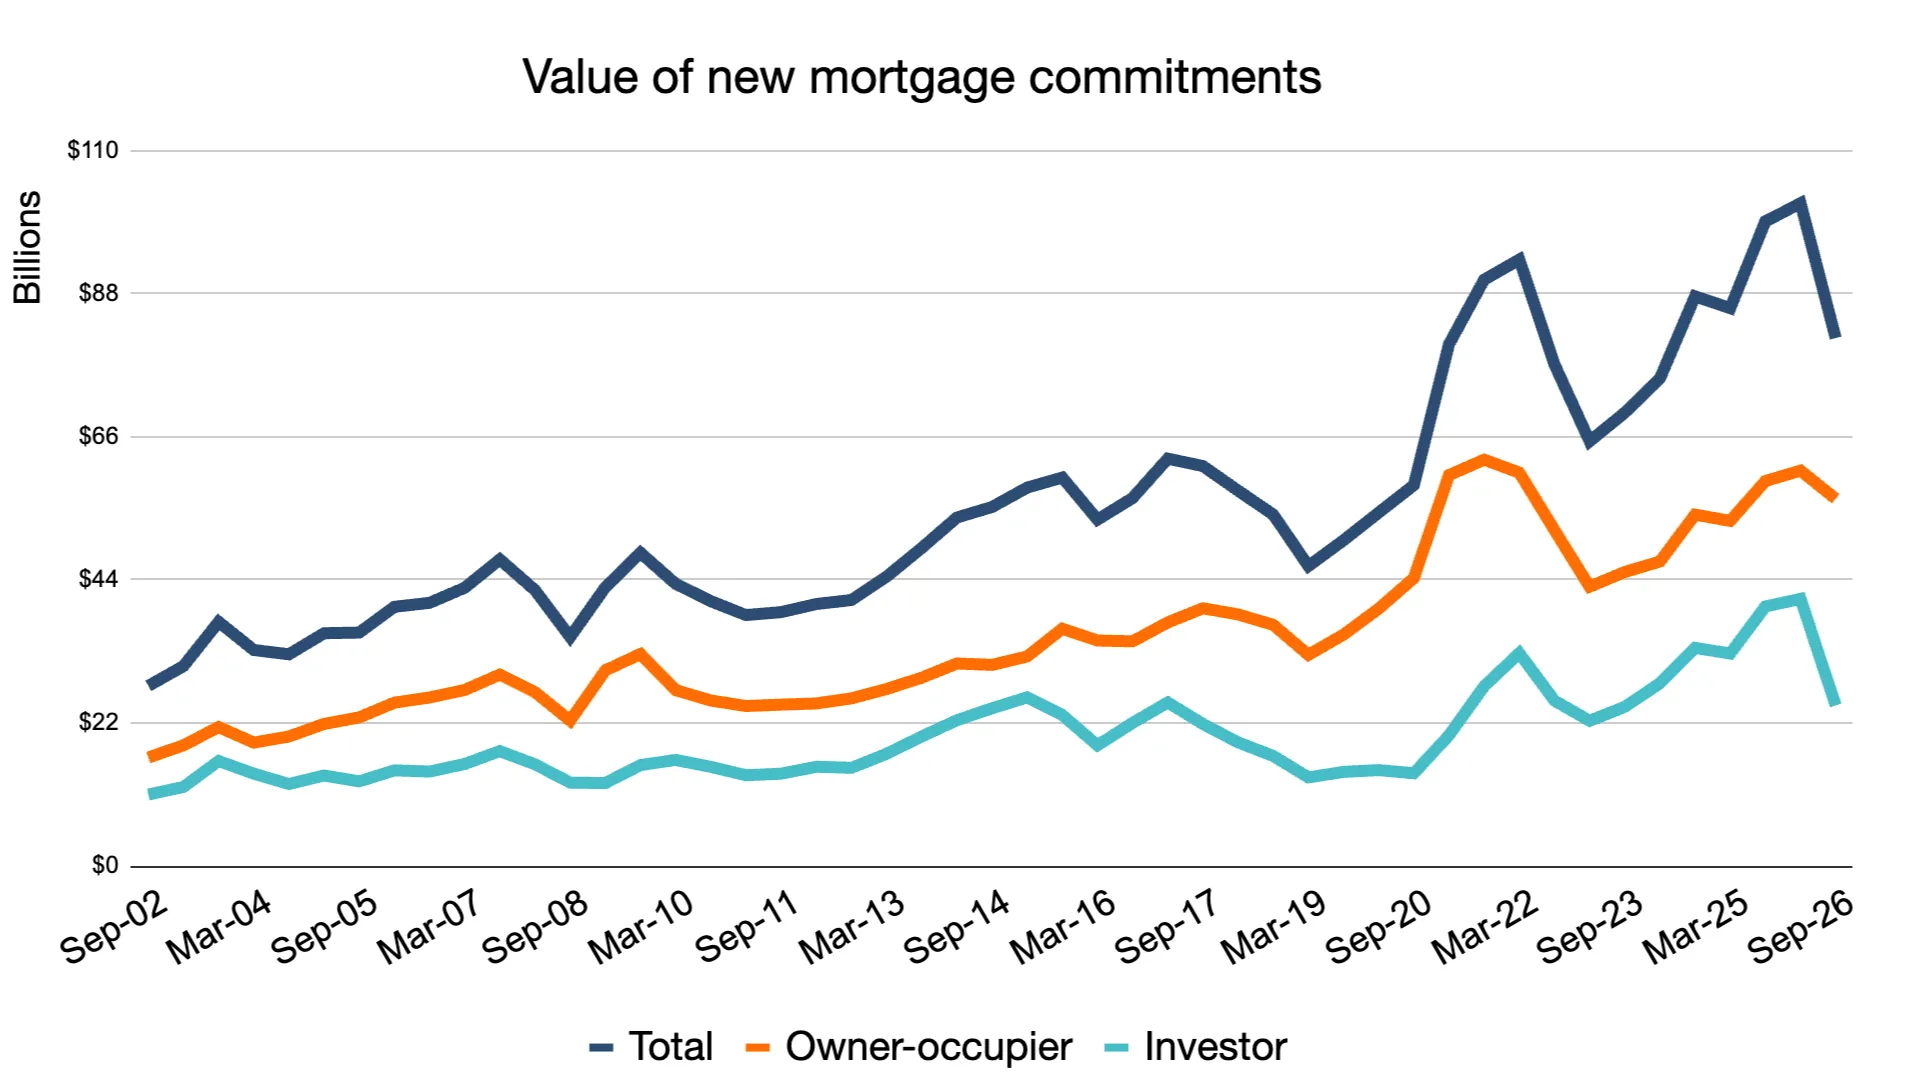
The value of new mortgages has taken a nosedive in the September quarter as buyers hit the brakes following the RBA hikes and the government’s property tax changes.
ABS lending indicator data, released today, shows the total value of new housing loans settled in the September quarter was $81.2 billion, down $14.9 billion or 16% compared to the June quarter, in seasonally adjusted terms.
This is the third consecutive drop in the value of new loan commitments and the largest quarterly drop in the ABS records, which date back to 2002.
Unsurprisingly, investor lending took the biggest hit this quarter, with the value of new mortgages down $11.8 billion or 32% – the biggest drop on record.
Value of new lending in September quarter 2026 | |||
|---|---|---|---|
Loan type | Value of loans | Quarterly change | Annual change |
All loans | $81.2 billion | -$14.9 billion -16% | -$17.9 billion -18% |
Owner-occupied | $56.5 billion | -$3.1 billion -5% | -$2.7 billion -5% |
Investment | $24.7 billion | -$11.8 billion -32% | -$15.2 billion -38% |
Source: ABS Lending Indicators Sept 2026, prepared by Canstar. Based on seasonally adjusted figures.
Breaking down new investor lending further, the biggest drop was in the purchases of existing dwellings, while investor purchases of new builds rose, albeit by 1%.
Value of new investor lending in September quarter 2026 | |||
|---|---|---|---|
Purpose | Value of loans | Quarterly change | Annual change |
Purchase of existing homes | $17.8 billion | -$11.0 billion -38% | -$15.3 billion -46% |
Purchase of new homes | $1.7 billion | +$19 million +1% | -$6 million -0.4% |
Construction of new properties | $5.1 billion | -$814.5 million -14% | +$123 million +2% |
Other (land, additions + alterations) | $2.0 billion | -$397 million -16% | -$322 million -14% |
Source: ABS Lending Indicators Sept 2026, prepared by Canstar. Based on seasonally adjusted figures
First home buyers snapping up greater share of sales
After surging back into the market in the December quarter, following the uncapping of the Home Guarantee scheme, first home buyer activity eased for the third quarter in a row, with the number of new owner-occupier first home buyer loans falling by 8.6% in the September quarter in seasonally adjusted terms. This was a drop of 2,494 loans.
However, owner-occupier first home buyer loans accounted for 23.6% of all new lending in the September quarter, which was the highest proportion since December 2023. The highest proportion recorded was 31.8% in September 2020.
Every state and territory recorded a fall in owner-occupier first home buyer lending in the September quarter. See end of release for state-by-state breakdown.
First home buyer owner-occupier mortgages | |||
|---|---|---|---|
Sept 26 quarter | Quarterly change | Annual change | |
Value | $16.2 billion | -$1.4 billion -8% | -$623 million -4% |
Number | 26,415 | -2,494 -9% | -3,721 -12% |
Source: ABS Lending Indicators September 2026, prepared by Canstar. Based on seasonally adjusted figures.
Average new loan size defies gravity
The national average new owner-occupier loan size increased in the September quarter, despite falling property prices, to $736,000 after falling in the previous two quarters.
NSW continues to have the largest average new loan size in the country for owner-occupiers at $847,000, rising by $5,000 or 0.6% this quarter.
Queensland, Western Australia and Northern Territory’s average new loan size ticked up slightly to post record highs, while the rest of the country flatlined.
All average new owner-occupier loan sizes are still up from the same quarter a year ago.
Average new owner-occupier loan size in September 2026 quarter | |||
|---|---|---|---|
Loan size | Quarterly change | Annual change | |
Australia | $736,000 | +$5,000 +0.7% | +$41,000 +6% |
NSW | $847,000 | +$5,000 +0.6% | +$17,000 +2% |
Vic | $669,000 | +$5,000 +0.8% | +$22,000 +3% |
Qld | $754,000 - record high | +$3,000 +0.4% | +$66,000 +10% |
SA | $667,000 | -$5,000 -0.7% | +$49,000 +8% |
WA | $721,000 - record high | +$1,000 +0.1% | +$88,000 +14% |
Tas | $516,000 | No change | +$33,000 +7% |
NT | $557,000 - record high | +$11,000 +2% | +$75,000 +16% |
ACT | $660,000 | -$6,000 -0.9% | +$32,000 +5% |
Source: ABS Lending Indicators September 2026, prepared by Canstar. Based on seasonally adjusted figures. Data is in original terms and rounded to the nearest $1,000.
Rate pain pushing borrowers away from the majors
ABS lending indicator data shows the major banks, while still very much the dominant force in the mortgage market, have lost ground to non-bank lenders.
The September 2026 data shows the big banks accounted for 68% of all new loans committed in the quarter, excluding refinanced loans, down from 72% the year prior (September 2025 quarter).
Non-bank lenders, on the other hand, have picked up the difference, accounting for 14% of all new loans committed in the most recent quarter, up from 7% a year ago.
Majors vs other banks vs non-banks: proportion of new loans committed | |||
|---|---|---|---|
Sept 25 qtr | Sept 26 qtr | Change %-pts | |
Majors | 72% | 68% | -4 |
Other banks | 21% | 18% | -2 |
Non-banks | 7% | 14% | +7 |
Source: ABS lending indicators, Sept quarter data, released 11 Nov 26, seasonally adjusted data, excludes refinanced loans. Prepared by Canstar.
Refinancing falls for second quarter in a row
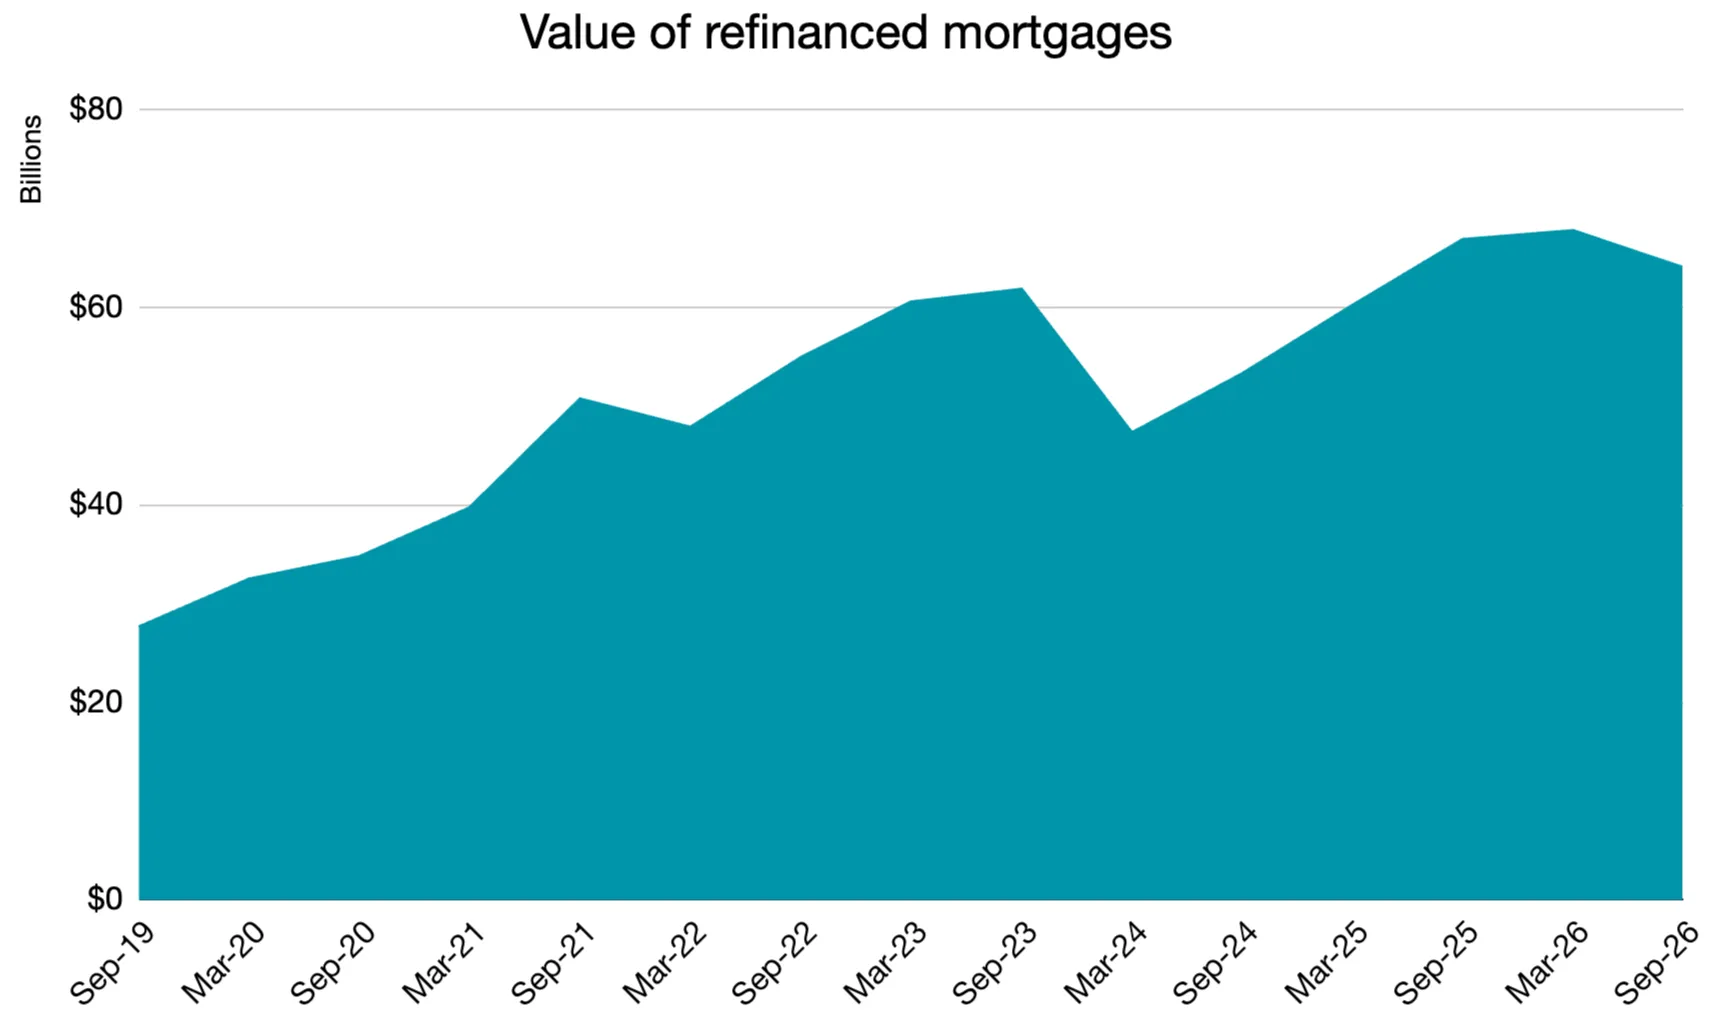
Switching activity eased in the September quarter, with the total value of loans refinanced falling 4% to $64.0 billion in seasonally adjusted terms, the second quarterly drop in a row.
However, today’s figures show refinancing remains elevated and comes off the back of the four highest refinancing quarters on record, in dollar terms, on the back of the 2026 RBA rate hikes and a ramping up of the mortgage wars.
Total number and value of externally refinanced mortgages | |||
|---|---|---|---|
Sept 26 quarter | Quarterly change | Annual change | |
Value | $64.0 billion | -4% | -4% |
Number | 97,618 | -5% | -7% |
Source: ABS Lending Indicators September 2026, prepared by Canstar. Based on seasonally adjusted figures.
Mortgage market has gone from red hot to decidedly chilly
Canstar's Data Insights Director, Sally Tindall, says, “The mortgage market has gone from red hot to decidedly chilly, with buyers seemingly hitting the pause button on the back of the RBA rate hikes and the government’s changes to property tax.”
“Investors have really slammed on the brakes. A 32 per cent drop in new investor lending in the space of three months is the biggest fall we’ve seen in ABS records, which date all the way back to 2002.
“RBA rate hikes and an overhaul to property tax rules might have changed the equation for investors but what really can get them spooked is a concerted slide in property prices. While some might have benched themselves for good, others are likely to be waiting patiently on the sidelines for the market to hit the bottom of the downturn.
“First home buyer numbers are on the slide, along with the rest of the market but the exodus by investors has given some the clear space to negotiate a contract of sale.
“The fact that first home buyers accounted for a bigger slice of new loans last quarter is a promising sign but with borrowing power being squeezed by higher rates, the road into home ownership is hardly easy.
“The big four banks are still dominating the mortgage market, but they’re now notably losing some of their ground, and it’s not the smaller banks.
“Non-bank lenders have doubled their share of new lending over the past year, climbing from 7 to 14 per cent. That’s a significant shift in a relatively short period and it shows borrowers are increasingly looking beyond the traditional banking heavyweights.”
Number of first home buyer loans by state | |||
|---|---|---|---|
Sept 26 quarter | Quarterly change | Annual change | |
Australia | 26,415 | -9% | -12% |
NSW | 6,405 | -7% | -10% |
Vic | 8,337 | -10% | -16% |
Qld | 4,878 | -12% | -15% |
SA | 1,915 | -11% | +6% |
WA | 3,211 | -9% | -7% |
Tas | 396 | -37% | -35% |
NT | 221 | -12% | -11% |
ACT | 790 | -8% | -7% |
Source: ABS Lending Indicators September 2026, prepared by Canstar. Based on seasonally adjusted figures.
