


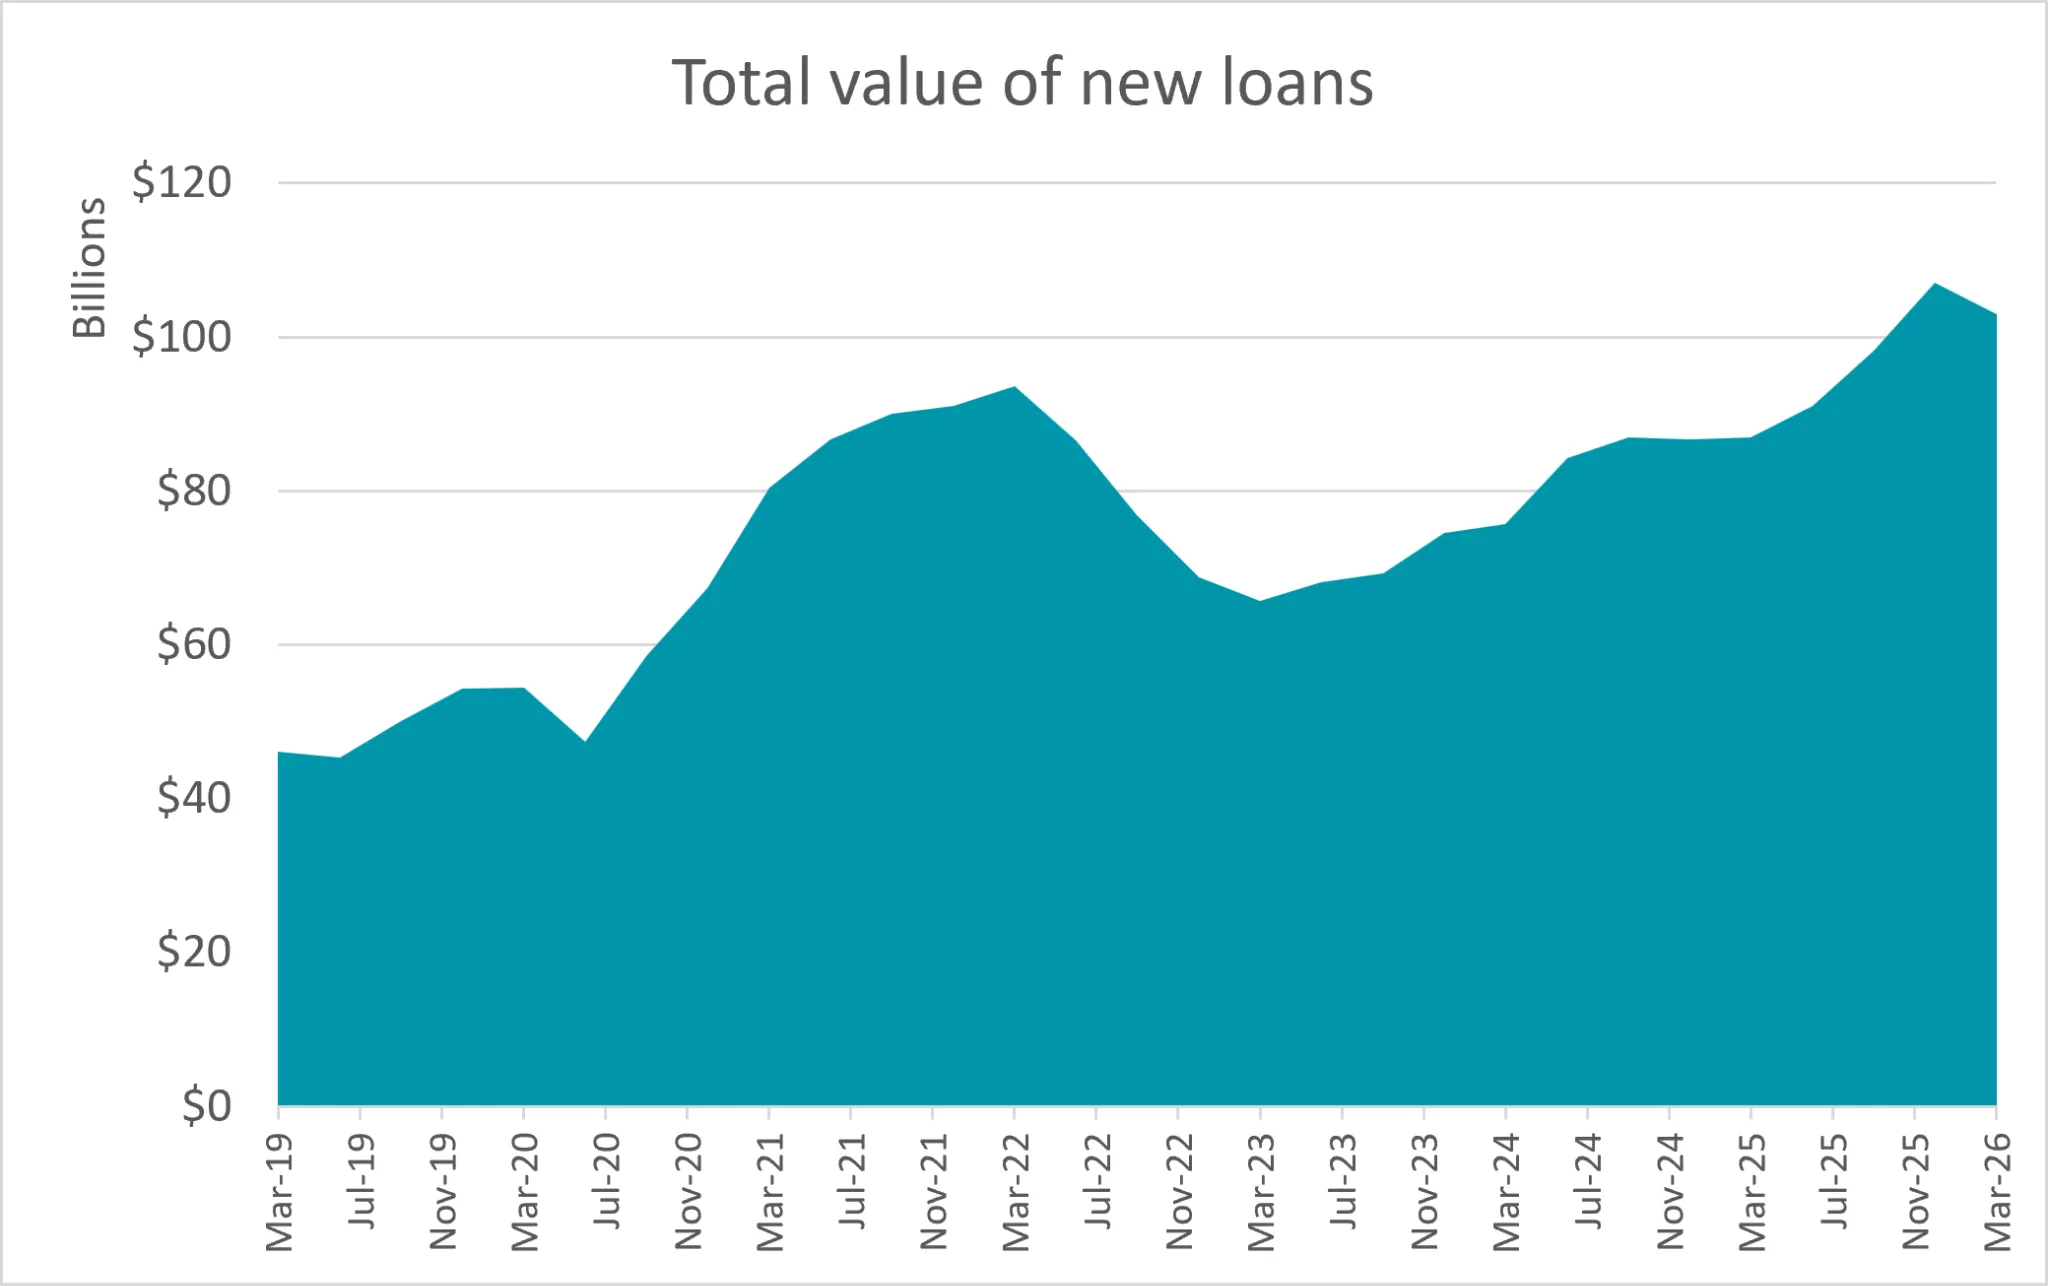
The residential mortgage market has recorded its first significant drop since the last rate hike cycle, with the total value of new housing loans falling by $4 billion in the March 2026 quarter, down 4% to $103 billion, according to new ABS data.
Our analysis shows owner-occupier borrowers drove the decline, with the value of new loans dropping by $2.8 billion, or 4%, from the record-breaking December 2025 quarter, in seasonally adjusted terms.
Investors also pulled back, with the value of new loans falling by $1.3 billion, or 3%, over the first three months of the year.
Despite the dip, new lending remains well above the levels a year ago, up 18% across all loans, led by investors, which surged 25% year-on-year.
Value of new lending in | |||
|---|---|---|---|
Loan | Value of | Quarterly | Annual |
All loans | $103.0 billion | -4% | +18% |
Owner-occupied | $61.4 billion | -4% | +14% |
Investment | $41.5 billion | -3% | +25% |
Source: ABS Lending Indicators March 2026, prepared by Canstar. Based on seasonally adjusted figures.
Average new loan size falls lead by drops in NSW and Victoria
The average national new owner-occupier loan size was $735,000 in the March quarter. This was a drop, albeit a small one, of $1,000 (-0.1%) from the peak recorded in the December 2025 quarter.
NSW continues to have the largest average new loan size in the country for owner-occupiers at $860,000, despite a $13,000 fall over the quarter. The drop in loan sizes suggests some buyers have hit their borrowing limits, with successive rate hikes slashing borrowing power by tens of thousands of dollars, pushing them to the sidelines.
Victoria’s average loan size also edged down to $675,000.
Every other state and territory recorded record-high average loan sizes this quarter. All data is in original terms and rounded to the nearest $1,000.
Average new | |||
|---|---|---|---|
Loan | Quarterly | Annual | |
Australia | $735,000 | -0.1% | +11% |
NSW | $860,000 | -1% | +8% |
VIC | $675,000 | -0.3% | +7% |
QLD | $741,000 - | +1% | +16% |
SA | $664,000 - | +1% | +12% |
WA | $703,000 - | +2% | +18% |
TAS | $521,000 - | +3% | +7% |
NT | $536,000 - | +4% | +10% |
ACT | $665,000 - | +1% | +8% |
Source: ABS Lending Indicators March 2026, prepared by Canstar. Average loan size based on original terms for owner-occupier dwellings, excludes refinancing and is rounded to the nearest $1,000.
First home buyer boom cools
After surging back into the market last quarter, following the uncapping of the Home Guarantee scheme on 1 October, first home buyer activity eased in the March quarter, slipping by 1,349 loans, or 4% in seasonally adjusted terms.
However, first home buyer lending remains significantly stronger than a year ago, with the value of new first home buyer loans up 18% annually.
Victoria saw the highest number of first home buyers entering the market this quarter, with 9,724 new loans taken out.
First home buyer | |||
|---|---|---|---|
March 26 | Quarterly | Annual | |
Value | $17.9 billion | -7% | 18% |
Number | 30,241 | -4% | 5% |
Source: ABS Lending Indicators March 2026, prepared by Canstar. Based on seasonally adjusted figures.
Number of | |||
|---|---|---|---|
March | Quarterly | Annual | |
NSW | 7,443 | -4% | +11% |
VIC | 9,724 | -5% | +0.5% |
QLD | 5,673 | -6% | +2% |
SA | 1,772 | -6% | -2% |
WA | 3,741 | -2% | +2% |
TAS | 591 | -1% | +13% |
NT | 196 | -21% | -18% |
ACT | 960 | +7% | +27% |
Source: ABS Lending Indicators March 2026, prepared by Canstar. Number of owner occupier new loan commitments, seasonally adjusted figures.
Refinancing slips from record high
Owner-occupier borrowers continued to refinance at record levels in the March quarter, with $43 billion worth of loans switched to a new lender over those three months, as households looked to soften the impact of higher rates.
Overall, however, refinancing activity eased slightly from its December quarter peak, with the total value of loans refinanced falling 0.2% to $68.2 billion in seasonally adjusted terms. The decline was driven by a 1% drop in investor refinancing activity.
Total number and value | |||
|---|---|---|---|
Amount | Change since | Year-on-year | |
Number | 103,798 | -401 -0.4% | +5,702 +6% |
Value | $68.2 billion | -$167 million -0.2% | $7.2 billion +12% |
Source: ABS Lending Indicators March 2026, prepared by Canstar. Number and value of refinanced loans includes owner-occupier and investor loans, seasonally adjusted data.
How much can a typical borrower save by refinancing?
Our research shows an owner-occupier who took out a new mortgage five years ago and hasn’t renegotiated their loan since will land on a variable rate of 7.01% after the May rate hike gets passed on.
By switching to a highly competitive rate of 5.99%, a borrower with a $600,000 loan could potentially save over $11,000 in the next two years, even when factoring in $1,150 in switch costs.
Potential impact | |||
|---|---|---|---|
| Rate | Cost - | Difference |
Do | 7.01% | $82,875 |
|
Refinance | 5.99% | $71,790 | -$11,085 |
Source: Canstar.
Notes: calculations are estimates based on an owner occupier who took out an average variable rate mortgage 5 years ago and has not renegotiated since. The person now has $600k debt and 25 years remaining. Savings include interest and switch costs of $1,150 but not ongoing fees or extra repayments.
Affordability remains the housing market’s Achilles’ heel
Canstar's Data Insights Director, Sally Tindall, says, “The residential home loan market has climbed past its peak and has begun its descent down the mountain, at least for now.”
“Back-to-back cash rate hikes have put a lid on some home buyer’s budgets, which were already stretched by stubbornly-high living costs.
“The average national new loan size has fallen from its record high late last year, dragged down by drops in key markets of NSW and Victoria, where property prices have been on the slide.
“Borrowing appetite is still at elevated levels, however, with investors leading the charge. The ABS data shows the value of new investor loans is up an astounding 25 per cent compared to the previous year.
“With growth at that pace, it’s easy to see why housing has become the focus in the federal budget, with the government under pressure to ease affordability constraints for younger Australians.
“First home buyers burst out of the gates at the tail end of last year, following the uncapping of the Home Guarantee Scheme in October. However, the initial frenzy appears to be cooling on the back of the RBA’s return to rate hikes.
“Affordability remains the housing market’s Achilles’ heel. The softening in Sydney and Melbourne prices isn’t the golden ticket buyers were hoping for with the rate hikes eroding borrowing power much faster than prices are easing.
“The challenge for those first home buyers who did manage to buy last year at peak prices with wafer-thin deposits, is that price dips in cities like Sydney and Melbourne.
“The March quarter could mark the start of a more cautious phase for the property market, particularly if borrowers continue to face rising repayments and tighter household budgets.”