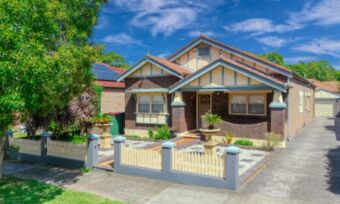
Melbourne property market forecast for 2024

Want to know the outlook for the Melbourne property market in 2024? Terry Ryder shares his thoughts on how things are looking.
The Melbourne market staged a remarkable turnaround in market activity in the June quarter, transitioning from a struggling market to one showing promise of considerable buoyancy in the next six months or so.
This is now starting to translate into price growth, although Melbourne lags Sydney, Brisbane, Perth and Adelaide on the growth in house and unit prices in the year to date.
The March quarter showed the first signs of recovery across Greater Melbourne markets, following the decline seen in 2022, but it was the June quarter that provided compelling evidence that Melbourne was starting to come back strongly as part of a national resurgence in sales activity.
The number of locations classified in Hotspotting’s quarterly surveys of sales volumes as rising markets increased five-fold in the June quarter and recovering markets quadrupled.
What property markets in Melbourne are the strongest?
The standout market was the City of Melbourne (the CBD and near-city suburbs like North Melbourne and Carlton), which is rising on the emerging national trend of buyers opting increasingly for apartments as a lifestyle choice or an affordability measure. Of the 10 City of Melbourne suburbs in the Hotspotting analysis, seven were rising markets.
The nearby City of Yarra also had four rising markets (Abbotsford, Clifton Hill, Collingwood and Fitzroy) and two recovering ones among the seven suburbs in the analysis.
But the outer-ring municipalities perhaps best illustrated the recovery trend in the Greater Melbourne market.
The City of Casey in the far south-east, which previously had many declining suburbs, had three rising and nine recovering suburbs (including suburbs like Doveton, Botanic Ridge, Cranbourne and Endeavour Hills) among 15 suburbs in the analysis of June Quarter activity.
The neighbouring City of Frankston was another market showing emphatic signs of recovery.
Outer-ring LGAs in the north and west, including Whittlesea, Hume, Wyndham and Melton, also demonstrated the recovering theme in the Melbourne market.
The revival trend extended to middle market precincts like the City of Whitehorse, including the suburbs of Box Hill and Burwood East.
The Mornington Peninsula, previously a national leader in price growth but past its peak in the past 12 to 18 months, is also showing increasing evidence of recovery, including in the prestige suburb of Sorrento.
What is the property market forecast for Melbourne in 2024?
The upsurge in sales activity, ahead of the Spring selling season, boded well for a return to price growth across Greater Melbourne and this is now showing up in the price data from CoreLogic and PropTrack.
The Hedonic Home Value Index published by CoreLogic on 1 November confirmed that Melbourne has been lagging behind other cities on price growth in calendar 2023. In the first 10 months of the year, house prices rose 12.1% in Sydney, 11.1% in Perth and 10.3% in Brisbane, while Melbourne increased only 4.1%.
But the figures showed a continuation of month-to-month growth of 0.4% and also quarterly growth of 1.0%.
The growing trend of buyers opting for units and townhouses, evident in inner-city municipalities such as Melbourne and Yarra, is showing up also in price movements in suburbs across Greater Melbourne.
Indeed, recent price data shows higher growth for apartments than for houses, with unit prices up 0.7% in October and 1.5% in the October quarter.
Melbourne’s residential vacancy rate has continued to fall, according to SQM Research – from 1.3% in August to 1.2% in September, compared to 1.8% in September 2022.
Asking rents in Melbourne, according to SQM, have risen 20% for houses and 15% for units in the 12 months to October.
Perhaps the major negatives impacting the property market in Melbourne and Victoria are increased taxes on property owners – including the windfall gains tax, land tax and vacancy tax – as well as caps on rents and a new levy on investors who use short-term letting platforms such as Airbnb.
Compare Home Loans (Refinance with variable rate only) with Canstar
If you’re currently considering a home loan, the comparison table below displays some of the variable rate home loans on our database with links to lenders’ websites that are available for homeowners looking to refinance. This table is sorted by Star Rating (highest to lowest), followed by comparison rate (lowest to highest). Products shown are principal and interest home loans available for a loan amount of $500,000 in NSW with an LVR of 80% of the property value. Consider the Target Market Determination (TMD) before making a purchase decision. Contact the product issuer directly for a copy of the TMD. Use Canstar’s home loans comparison selector to view a wider range of home loan products. Canstar may earn a fee for referrals.
The comparison rate for all home loans and loans secured against real property are based on secured credit of $150,000 and a term of 25 years.
^WARNING: This comparison rate is true only for the examples given and may not include all fees and charges. Different terms, fees or other loan amounts might result in a different comparison rate.
 Owner occupied
 20% min deposit
 Redraw facility

Up to $3,000 when you refinance with a Greater Bank home loan. Minimum loan amounts and LVR restrictions apply. Offer available until further notice. See provider website for full details. Exclusions, terms and conditions apply.
 Owner occupied
 20% min deposit
 Redraw facility

Up to $3,000 when you take out a IMB home loan. Minimum loan amounts and LVR restrictions apply. Offer available until further notice. See provider website for full details. Exclusions, terms and conditions apply.
 Owner occupied
 20% min deposit
 Redraw facility
 Owner occupied
 10% min deposit
 Redraw facility
 Owner occupied
 20% min deposit
 Redraw facility
Canstar is an information provider and in giving you product information Canstar is not making any suggestion or recommendation about a particular product. If you decide to apply for a home loan, you will deal directly with a financial institution, not with Canstar. Rates and product information should be confirmed with the relevant financial institution. Home Loans in the table include only products that are available for somebody borrowing 80% of the total loan amount. For product information, read our detailed disclosure, important notes and additional information. *Read the comparison rate warning. The results do not include all providers and may not compare all the features available to you.
Home Loan products displayed above that are not “Sponsored or Promoted” are sorted as referenced in the introductory text followed by Star Rating, then lowest Comparison Rate, then alphabetically by company. Canstar may receive a fee for referral of leads from these products.
When you click on the button marked “Enquire” (or similar) Canstar will direct your enquiry to a third party mortgage broker. If you decide to find out more or apply for a home loan, you can provide your details to the broker. You will liaise directly with the broker and not with Canstar. When you click on a button marked “More details” (or similar), Canstar will direct your enquiry to the product provider. Canstar may earn a fee for referral of leads from the comparison table above. See How We Get Paid for further information.
Cover image source: Brett Ginsberg/Shutterstock.com
This article was reviewed by our Editorial Campaigns Manager Maria Bekiaris before it was updated, as part of our fact-checking process.

The comparison rate for all home loans and loans secured against real property are based on secured credit of $150,000 and a term of 25 years.
^WARNING: This comparison rate is true only for the examples given and may not include all fees and charges. Different terms, fees or other loan amounts might result in a different comparison rate.

Up to $3,000 when you take out a IMB home loan. Minimum loan amounts and LVR restrictions apply. Offer available until further notice. See provider website for full details. Exclusions, terms and conditions apply.
 Owner occupied
 20% min deposit
 Redraw facility
Try our Home Loans comparison tool to instantly compare Canstar expert rated options.
The comparison rate for all home loans and loans secured against real property are based on secured credit of $150,000 and a term of 25 years.
^WARNING: This comparison rate is true only for the examples given and may not include all fees and charges. Different terms, fees or other loan amounts might result in a different comparison rate.


