10 best suburbs to invest in Melbourne in 2025
Looking to buy a property in Melbourne? These are the 10 best suburbs to invest in Melbourne for 2025, based on recent market performance.
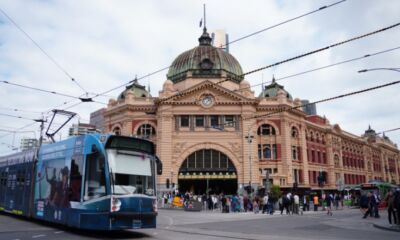
Looking to buy a property in Melbourne? These are the 10 best suburbs to invest in Melbourne for 2025, based on recent market performance.
KEY POINTS
- Investors are leaving the Melbourne market, due in part to high property taxes and anti-investor State Government policies.
- Melbourne’s median property price has been overtaken by Brisbane and is being challenged by Adelaide and Perth, which may help the city attract bargain hunting homebuyers.
- Melbourne’s infrastructure spending is one of its biggest bright spots, with over $100 billion worth of developments currently in the works.
Victoria’s capital city was shaping up as “the big improver” in the Australian market for 2024. However, the Melbourne property market failed to ignite, despite the data suggesting it would do otherwise.
Melbourne has been hampered by a state government with the highest property taxes in the nation, and an expanding repertoire of anti-investor policies. Research from the Property Investment Professionals of Australia (PIPA) indicates that property investors have been selling rather than buying in Melbourne and Victoria—and this may cause vacancy rates to tighten throughout 2025.
In 2024, Melbourne prices fell both for houses (down 2.7%) and units (down 1.6%), one of the weakest results in the nation. 2025 outcomes are likely to be moderate at best. The city is strong on rental growth and infrastructure investment, but is an under-achiever on sales activity, recent price uplift and vacancy rates.
Hopes for better market performance boil down to high level population growth—boosted by overseas migration and international students— and ongoing rollout of major infrastructure projects.
A further factor is the relative affordability of Melbourne house prices. After two weak years, Melbourne’s median price has been overtaken by Brisbane and is being challenged by Adelaide and Perth, so the city may attract bargain hunters.
The data below was prepared in February 2025 with suburb median prices, growth rates, vacancy rates and median rental yields provided by Hotspotting by Ryder and initial outlay and monthly repayments calculated by Canstar Research.
Top 10 best suburbs to invest in Melbourne in 2025
- Bayswater
- Boronia (Unit)
- Clayton South (Unit)
- Cranbourne North
- Frankston North
- Heidelberg West
- Jacana
- Moonee Ponds (Unit)
- Preston (Unit)
- St Kilda (Unit)
Bayswater
There are multiple reasons why buyer demand is so consistent in the eastern suburb of Bayswater: it’s relatively affordable (median house price of $870,000), it has lots of green space including nearby Doongalla Forest, there are train links to Melbourne, a shopping centre, schools and a private hospital. Vacancies at 0.6%, well below city averages, and 11% rental growth in the past year, provide interest for investors.
Boronia (U)
Statistics show just how popular this eastern suburb is becoming: 201 house sales and 254 apartment sales in the past 12 months, with homes typically selling in three weeks, and vacancies well below average for Melbourne at 0.6% (rents up 13% in the past year). Its commercial-retail hub has two shopping centres and a train station linking to central Melbourne. The numerous schools in the suburb include four primary schools.
Clayton South (U)
Proximity to desirable features is a key to capital growth and, in a year where Melbourne prices declined, Clayton South unit prices rose 12% and rents increased 15%. This south-eastern suburb is close to the Monash Medical Centre, has train links to the city, as well as major shopping centres and extensive green spaces, including the Spring Valley Golf Club.
Cranbourne North
Buyer demand has risen steadily (361 house sales in the past year) in this well-connected south-eastern suburb in the fast-growing Casey municipality. Rents also rose (15%), with vacancies at 1.3%. Cranbourne North has good transport links via commuter rail and the South Gippsland Highway, and boasts major green spaces, including the Cranbourne Golf Club.
Frankston North
Affordable areas can defy their reputation and produce growth if they offer buyers desirable features. Frankston North attracts strong buyer demand because it has good transport links (commuter rail, the M3 and the M11) and major green spaces, including three golf courses, not far from the bay. Its five-year capital growth rate (7% a year) is above average for Melbourne and its vacancy rate is well below the city norm, with rents up 8%.
Heidelberg West
Suburbs close to major university campuses (in this case La Trobe University) always attract big rental demand—and rents in Heidelberg West rose 24% in the past year, with a vacancy rate of 1.2% as a result of this. House prices also had some growth, against city trends, with buyer demand on the rise. The suburb has a green space corridor and amenities like the Northland shopping centre.
Jacana
Few outer ring suburbs offer as much amenity as this northern suburb in the City of Hume: train links, fast access to major motorways, big green spaces, schools and proximity to major employment nodes (of which there are many in Melbourne’s north) are attractive to buyers and investors alike. All the key statistics for Jacana are better than Melbourne averages: the median house price is up 5% in the past year, vacancies at 0.6% and rents rising more than 20%.
Moonee Ponds (U)
This popular suburb a little north of the Melbourne CBD has rising buyer demand for its apartment market, with 270 unit sales in 2024 and a 7% median price rise at a time when Melbourne overall has struggled. Vacancies below the city average, rents up 10% and yields above 5% look good for investors. Moonee Ponds has rail links, supermarkets and lots of green space, including its renowned racing club and Queens Park.
Preston (U)
The suburbs of the City of Darebin have grown in popularity for their diversity, tram and train links, proximity to central Melbourne and relative affordability. Preston, in particular, sold over 400 units in the past year, with its median price rising 12% in defiance of city trends (a 3% decline) and rents up 10%. Shopping options in Preston include Northland Shopping Centre, Preston Market and Woolworths Preston South.
St Kilda (U)
You wouldn’t buy in iconic St Kilda based on its capital growth record, but its affordability and proximity to both beaches and the CBD is attracting a rising number of buyers—with 633 unit sales in the past year and a 4% increase in the median price to a still affordable $525,000. Rents rose 10%, helped by vacancies well below Melbourne averages, and a median yield of 5.4% will be appealing to investors.
The comparison rate for all home loans and loans secured against real property are based on secured credit of $150,000 and a term of 25 years.
^WARNING: This comparison rate is true only for the examples given and may not include all fees and charges. Different terms, fees or other loan amounts might result in a different comparison rate.
 Owner occupied
 20% min deposit
 Redraw facility
 Owner occupied
 10% min deposit
 Redraw facility
 Owner occupied
 20% min deposit
 Redraw facility
Canstar may earn a fee for referrals from its website tables, and from Sponsorship or Promotion of certain products. Fees payable by product providers for referrals and Sponsorship or Promotion may vary between providers, website position, and revenue model. Sponsorship or Promotion fees may be higher than referral fees. Sponsored or Promoted products are clearly disclosed as such on website pages. They may appear in a number of areas of the website such as in comparison tables, on hub pages and in articles. Sponsored or Promoted products may be displayed in a fixed position in a table, regardless of the product’s rating, price or other attributes. The table position of a Sponsored or Promoted product does not indicate any ranking or rating by Canstar. For more information please see How We Get Paid.
Best suburbs to invest in Melbourne 2025
← Mobile/tablet users, scroll sideways to view full table →
| Suburb | Median price |
1-year growth (p.a %) |
10-yr average annual growth (p.a %) |
Vacancy Rate |
Median Rental Yield (p.a %) |
Initial outlay (no concessions) on 20% deposit |
Monthly Repayment |
|---|---|---|---|---|---|---|---|
| Bayswater | $870,000 | 1% | 4% | 0.60% | 3.50% | $223,527 | $4,263 |
| Boronia (Unit) |
$665,000 | 1% | 3% | 0.60% | 4.10% | $169,747 | $3,258 |
| Clayton South (Unit) |
$590,000 | 12% | 2% | 1.50% | 5.00% | $150,071 | $2,891 |
| Cranbourne North |
$715,000 | 3% | 5% | 1.30% | 4.30% | $182,864 | $3,503 |
| Frankston North |
$590,000 | 3% | 7% | 1.10% | 4.40% | $150,071 | $2,891 |
| Heidelberg West |
$770,000 | 3% | 3% | 1.20% | 3.50% | $197,293 | $3,773 |
| Jacana | $595,000 | 5% | 3% | 0.60% | 4.40% | $151,383 | $2,915 |
| Moonee Ponds (Unit) |
$585,000 | 7% | 4% | 1.60% | 5.20% | $148,760 | $2,866 |
| Preston (Unit) |
$620,000 | 12% | 4% | 1.60% | 4.50% | $157,942 | $3,038 |
| St Kilda (Unit) |
$525,000 | 4% | -1% | 1.20% | 5.40% | $129,919 | $2,572 |
Source: www.canstar.com.au. Prepared in February 2025. Based on a selection of suburbs’ median prices, growth and rent figures provided by Hotspotting by Ryder. Initial outlay figures include the deposit, stamp duty, mortgage registration and transfer fees; and lenders’ mortgage insurance (LMI) premium for the 10% deposit scenarios. Stamp duty calculated based on an owner occupier purchase of an established dwelling where applicable. FHB concessions include stamp duty only. LMI premium based on Helia LMI Premium Calculator for an owner occupier borrower and a loan term of 30 years. Monthly repayments calculated based on the interest rates of 6.20% (20% deposit) and 6.34% (10% deposit) and a loan term of 30 years. Interest rates based on the RBA Lenders’ Interest Rates (November 2024). Percentage of income based on the average total income by Greater Capital City Statistical Area (ABS Personal Income, 2021-22), adjusted by the ABS Wage Price Index (Sep-2024) for each state.
What are some of the factors that are impacting the Melbourne market?
Sales volumes
The Melbourne market has solid activity, with 46% of suburbs showing positive trends with sales volumes.
Quarterly price growth
Melbourne has not experienced the price growth seen in the capital cities and regional areas of other states, with the city’s median prices falling last year. Recent data provides little optimism for improvement, with only 16% of suburbs recording uplift above the 2% benchmark level.
Vacancy rates
It’s indicative of just how low vacancies are nationwide that a city with a vacancy rate below 2% is one of the weakest performers in the nation. A third of Melbourne suburbs are below 1% but some of the best Australian markets for vacancy rates have at least two-thirds at this level.
Rental growth
This is Melbourne’s best metric and one on which it leads nationally—86% of the city’s suburbs recorded rental growth above 5% last year, despite the city having a relatively high vacancy rate—though still well below the 3% threshold which depicts a balanced rental market. Melbourne rents have greater capacity to rise because for some years they have been much lower than other capital cities.
Infrastructure spending
A key reason for optimism that the Melbourne market could improve in the future is the high level of investment in infrastructure projects. Developments in the mix total well over $100 billion, including big-ticket transport projects.
The comparison rate for all home loans and loans secured against real property are based on secured credit of $150,000 and a term of 25 years.
^WARNING: This comparison rate is true only for the examples given and may not include all fees and charges. Different terms, fees or other loan amounts might result in a different comparison rate.

Up to $4,000 when you take out a IMB home loan. Minimum loan amounts and LVR restrictions apply. Offer available until further notice. See provider website for full details. Exclusions, terms and conditions apply.
 Owner occupied
 20% min deposit
 Redraw facility
 Owner occupied
 10% min deposit
 Redraw facility
 Owner occupied
 20% min deposit
 Redraw facility
 Owner occupied
 20% min deposit
 Redraw facility
 Owner occupied
 40% min deposit
 Redraw facility
 Owner occupied
 40% min deposit
 Redraw facility
Canstar may earn a fee for referrals from its website tables, and from Sponsorship or Promotion of certain products. Fees payable by product providers for referrals and Sponsorship or Promotion may vary between providers, website position, and revenue model. Sponsorship or Promotion fees may be higher than referral fees. Sponsored or Promoted products are clearly disclosed as such on website pages. They may appear in a number of areas of the website such as in comparison tables, on hub pages and in articles. Sponsored or Promoted products may be displayed in a fixed position in a table, regardless of the product’s rating, price or other attributes. The table position of a Sponsored or Promoted product does not indicate any ranking or rating by Canstar. For more information please see How We Get Paid.
Cover image source: Softvisual/Shutterstock.com
This article was reviewed by our Finance Editor Jessica Pridmore before it was updated, as part of our fact-checking process.

The comparison rate for all home loans and loans secured against real property are based on secured credit of $150,000 and a term of 25 years.
^WARNING: This comparison rate is true only for the examples given and may not include all fees and charges. Different terms, fees or other loan amounts might result in a different comparison rate.
 Owner occupied
 20% min deposit
 Redraw facility
Try our Home Loans comparison tool to instantly compare Canstar expert rated options.
The comparison rate for all home loans and loans secured against real property are based on secured credit of $150,000 and a term of 25 years.
^WARNING: This comparison rate is true only for the examples given and may not include all fees and charges. Different terms, fees or other loan amounts might result in a different comparison rate.
