The top growth suburbs of the past 20 years
Find out which suburbs in Adelaide, Brisbane, Melbourne and Sydney have experienced the best capital growth over the past 20 years. Is yours on the list?
If you bought a home in Kilburn in South Australia in 2000 and still owned it you should give yourself a pat on the back as your investment could have grown by 683% in that time. Kilburn was the top-performing suburb in that timeframe according to data compiled by realestate.com.au which identified the biggest growth suburbs of the past 20 years in Adelaide, Brisbane, Sydney and Melbourne.
Tyabb in Victoria’s Mornington Peninsula was close behind with the median price increasing by 682% from $121,500 in June 2000 to $950,000 in June 2020.
The top long-term performer in Sydney was Harrington Park where median prices grew by 549% over that 20-year period while in Brisbane it was Windsor with a return of 492% since 2000.
Nerida Conisbee, realestate.com.au Chief Economist, told Canstar that home buyer preferences have changed over that time. “Twenty years ago, it was popular to live in the suburbs, in big homes on big blocks. Since then, we’ve seen a shift towards coastal living and also inner-city living with amenities within walking distance,” she explained.
“There has also been a lot of gentrification in suburbs that younger people have moved into. Younger demographics tend to renovate and demand better local services, which gives suburbs a renewed energy and often leads to big price growth.

“Suburbs that have undergone urban renewal or have become more desirable to buyers as their preferences shifted, have recorded strong price growth.”
Let’s take a look at the top 10 in Adelaide, Brisbane, Melbourne and Sydney.
Adelaide and surrounds
With the median house price increasing from $55,500 in June 2000 to $434,400 in June 2020 Kilburn, which is about 9 kilometres north of the CBD, is by far the best performer in Adelaide. Interestingly it shares the same postcode as Blair Athol which is fourth on the list with a return of 413% over 20 years – still nothing to sneeze at. In fact the top six suburbs in Adelaide are all in close proximity to each other.
Seaside suburb Henley Beach, which is about a 20-minute drive from Adelaide city, was seventh on the list with the median price growing by 368% over the 20 years and is now nearing $1 million.
| Adelaide & surrounds, SA: Top 10 growth suburbs over the past 20 years | |||
|---|---|---|---|
| Suburb | Growth | Median house price
June 2000 |
Median house price
June 2020 |
| Kilburn | 683% | $55,500 | $434,400 |
| Greenacres | 442% | $85,400 | $462,500 |
| Northfield | 426% | $85,000 | $447,000 |
| Blair Athol | 413% | $97,500 | $500,000 |
| Windsor Gardens | 397% | $96,000 | $477,500 |
| Clearview | 397% | $90,000 | $447,500 |
| Henley Beach | 368% | $201,000 | $940,000 |
| Willunga | 366% | $125,000 | $582,500 |
| Rosewater | 363% | $84,000 | $389,000 |
| Christies Beach | 357% | $80,000 | $365,500 |
| Source: realestate.com.au | |||
Brisbane and surrounds
Many of the suburbs to make the top 10 list in Brisbane were in inner-city locations. All have grown by more than 425% in the 20 years since the turn of the century. Six of the 10 suburbs had median prices of more than $1 million in June 2020.
Just 2 kilometres from the CBD riverside suburb New Farm has the highest median price of the suburbs on the list at $1.6 million. This is 442% more than the $295,000 median price in June 2000.
| Brisbane & surrounds, Qld: Top 10 growth suburbs over the past 20 years | |||
|---|---|---|---|
| Suburb | Growth | Median house price
June 2000 |
Median house price
June 2020 |
| Windsor | 492% | $183,000 | $1,082,500 |
| Bulimba | 481% | $240,000 | $1,395,000 |
| Coorparoo | 468% | $185,000 | $1,050,000 |
| Grange | 463% | $206,000 | $1,160,000 |
| Sandgate | 459% | $140,000 | $782,500 |
| Salisbury | 443% | $115,000 | $625,000 |
| New Farm | 442% | $295,000 | $1,600,000 |
| Rocklea | 433% | $76,500 | $408,000 |
| Hawthorne | 432% | $265,000 | $1,410,000 |
| Deagon | 427% | $91,000 | $480,000 |
| Source: realestate.com.au | |||
Melbourne and surrounds
Half of the suburbs in Melbourne’s top 10 list – Tyabb, Somers, Crib Point, Rye and Tootgarook – are located in the Mornington Peninsula region. Tyabb and Somers, which are the two best performers, now have median prices close to the $1 million mark at $950,000 and $970,051 respectively. Crib, Rye and Tootgarook are more affordable with median prices ranging from $525,000 and $702,500, despite all having grown by more than 475% since 2000.
Clayton, which is home to Monash University, is third on the list with the median price soaring by 560% to $1.2 million.
With a median price of $465,000 back in 2000 the inner-city suburb of Malvern would have no doubt been seen as expensive even back then. Given that the median price has increased by 502% to $2.8 million I can’t imagine anyone who bought a home and still owned it would be complaining.
| Melbourne & surrounds, Vic: Top 10 growth suburbs over the past 20 years | |||
|---|---|---|---|
| Suburb | Growth | Median house price
June 2000 |
Median house price
June 2020 |
| Tyabb | 682% | $121,500 | $950,000 |
| Somers | 574% | $144,000 | $970,051 |
| Clayton | 560% | $182,000 | $1,200,500 |
| Springvale | 510% | $125,000 | $762,000 |
| Malvern | 502% | $465,000 | $2,800,000 |
| Box Hill | 501% | $270,000 | $1,623,500 |
| Mont Albert North | 486% | $263,000 | $1,540,500 |
| Crib Point | 483% | $90,000 | $525,000 |
| Rye | 481% | $121,000 | $702,500 |
| Tootgarook | 477% | $104,000 | $600,000 |
| Source: realestate.com.au | |||
Sydney and surrounds
Harrington Park in the Macarthur region is in top spot. In 2000 a house in Harrington Park would have set you back less than $150,000 but by June 2020 you’d be paying $800,000 more as the median price is now $960,000. Nearby Currans Hill is in second place with the median price increasing by 530% over 20 years to $605,000.
Three of the locations to make the top 10 list are in the Central Coast region. They are Hamlyn Terrace (509%), Lisarow (383%) and Erina (376%).
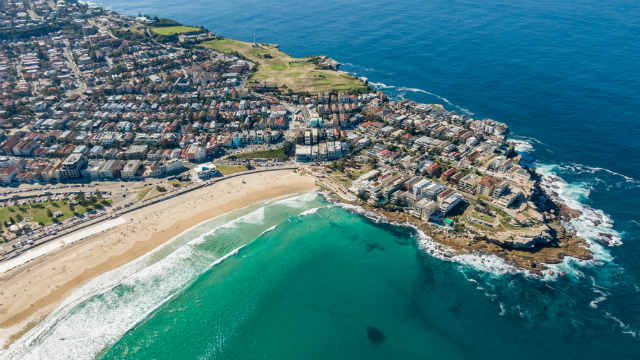
North Bondi in 10th spot is the suburb closest to the CBD on this list with the median price growing by 375% to a whopping $2.85 million.
| Sydney & surrounds, NSW: Top 10 growth suburbs over the past 20 years | |||
|---|---|---|---|
| Suburb | Growth | Median house price
June 2000 |
Median house price
June 2020 |
| Harrington Park | 549% | $148,000 | $960,000 |
| Currans Hill | 530% | $96,000 | $605,000 |
| Hamlyn Terrace | 509% | $101,500 | $618,000 |
| Rouse Hill | 472% | $164,000 | $938,000 |
| Beaumont Hills | 459% | $207,000 | $1,158,000 |
| West Hoxton | 424% | $159,250 | $835,000 |
| Canley Vale | 394% | $168,000 | $830,500 |
| Lisarow | 383% | $150,000 | $725,000 |
| Erina | 376% | $180,000 | $857,500 |
| North Bondi | 375% | $600,000 | $2,850,000 |
| Source: realestate.com.au | |||
This article was reviewed by Editorial Campaigns Manager Maria Bekiaris before it was published as part of our fact-checking process.
Main image source: gopixa (Shutterstock)
 About Effie Zahos
Canstar’s Editor-at-Large, Effie Zahos, has more than two decades of experience helping Aussies make the most of their money. Prior to joining Canstar, Effie was the editor of Money Magazine, having helped establish it in 1999. She is an author and one of Australia’s leading personal finance commentators, appearing regularly on TV and radio.


 Owner occupied
50% min deposit
Redraw facility
Owner occupied
50% min deposit
Redraw facility
Try our Home Loans comparison tool to instantly compare Canstar expert rated options.


