A well-known saying in investment circles is ‘Sell in May and go away’, but what does that mean and is there any truth to it? We’ve slapped on our deerstalker hat and whipped out our magnifying glass to uncover the mystery behind this popular mantra.
The old English adage, ‘Sell in May and go away’ warns investors to sell their shares in May to avoid a perceived seasonal decline in equity markets. Traditionally, some investors associated the saying with ‘…, don’t come back until St Leger Day’, which refers to final horse race of the British Triple Crown and typically takes place in mid-September. However, nowadays the ‘Sell in May’ period is generally defined as May to October, and returns are commonly compared to the other half of the year, November to April.
So, is there any truth to this saying? We take a look at the numbers to find out.
Wise-Owl.com, an ASX stock market research firm, examined the Dow Jones Industrial Average (DJIA) Index from 1900-2015 and found that historically stocks performed better in the November to April period. The frequency of positive returns over this period was 70% in comparison to 59% between May and October.
Performance comparison for the Dow Jones Industrial Average between 1900- 2015 | ||
---|---|---|
Dates | May – October | November – April |
Frequency of Positive Returns | 59% | 70% |
Median Return | 2.6% | 4.2% |
Average Return | 1.4% | 5.2% |
Source: Wise- Owl.com
It is important to note that both periods still saw positive returns. However, some investors may have earned greater returns by exiting the U.S. equity market in May, then using the proceeds invested in U.S. treasury bonds and subsequently sold their treasuries only to re-enter the equity market in November.
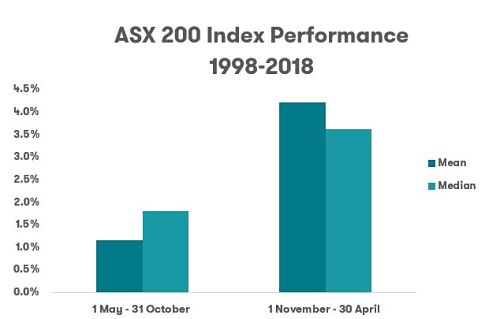
Looking at our local market, the ASX 200 index’s performance over the past two decades has echoed the same results as observed by Wise-Owl.com. Again, the November to April period delivered significantly higher returns than the other half of the year. However, investors were still historically better off holding shares throughout the year as both periods saw positive returns collectively.
According to a Barclays report, historically it is a trend that seems to be worldwide. They found, across all countries, on average returns from 1970-2017 were stronger in the period between November to April relative to the period of May to October.
On the basis of historical performance, it certainly does appear that there is some merit to the proverb ‘Sell in May and go away’. Although many financial analysts and academics have studied this global phenomenon, the causes of the seasonal under-performance across equity markets remains unknown. It may be that investors have simply come to expect a decline during the May to October period, and the expectation becomes self-fulling. Or perhaps, as this period falls over the northern hemisphere’s summer months, it may be reflecting the effects of fewer trades while investors are on holiday.
But, before you rush off you adjust your portfolio, take into consideration that past performance is not an indication of future performance. And keep in mind that this strategy does not suit everyone. As mentioned, some investors may be better holding stocks throughout the year as both periods have shown positive returns.
Want more articles like this sent straight to your inbox? Sign up for our newsletter below. Or, you can follow us on Facebook and X.
Try our Investor Hub comparison tool to instantly compare Canstar expert rated options.
This advice is general and has not taken into account your objectives, financial situation, or needs. It is not personal advice. Consider whether this advice is right for you, having regard to your own objectives, financial situation and needs. You may need financial advice from a suitably qualified adviser. For more information, read Canstar’s Financial Services and Credit Guide (FSCG) and our detailed disclosure. Canstar may receive a fee for referring you to a product provider – for further information, see how we get paid. Payment of fees for ads does not influence our Star Ratings or Awards.
Canstar is a comparison website, not a product issuer, so it’s important to check any product information directly with the provider. Consider the Product Disclosure Statement (PDS), Target Market Determination (TMD) and other applicable product documentation before making a decision to purchase, acquire, invest in or apply for a financial or credit product. Contact the product issuer directly for a copy of the PDS, TMD and other documentation.
Canstar is an information provider and in giving you product information Canstar is not making any suggestion or recommendation about a particular credit product or loan. If you decide to apply for a credit product or loan, you will deal directly with a credit provider, and not with Canstar. Rates and product information should be confirmed with the relevant credit provider. For more information, read the credit provider’s key facts sheet and other applicable loan documentation for that product. Read the Comparison Rate Warning.
All information about performance returns is historical. Past performance should not be relied upon as an indicator of future performance; unit prices and the value of your investment may fall or rise.
Canstar is an information provider and in giving you product information Canstar is not making any suggestion or recommendation about a particular product. The information has been prepared without taking into account your individual investment objectives, financial circumstances or needs. Before you decide whether or not to acquire a particular financial product you should assess whether it is appropriate for you in the light of your own personal circumstances, having regard to your own objectives, financial situation and needs. You may wish to obtain financial advice from a suitably qualified adviser before making any decision to acquire a financial product. Please refer to the product disclosure statement (PDS) and Canstar’s Financial Services and Credit Guide (FSCG) for more information, and read our detailed disclosure, important notes and liability disclaimer.
All information about performance returns is historical. Past performance should not be relied upon as an indicator of future performance; unit prices and the value of your investment may fall or rise.
Canstar may earn a fee for referrals from its website tables, and from Sponsorship or Promotion of certain products. Fees payable by product providers for referrals and Sponsorship or Promotion may vary between providers, website position, and revenue model. Sponsorship or Promotion fees may be higher than referral fees. Sponsored or Promotion products are clearly disclosed as such on website pages. They may appear in a number of areas of the website such as in comparison tables, on hub pages and in articles. Sponsored or Promotion products may be displayed in a fixed position in a table, regardless of the product's rating, price or other attributes. The table position of a Sponsored or Promoted product does not indicate any ranking or rating by Canstar. For more information please see How We Get Paid.
Any advice provided on this website is general and has not taken into account your objectives, financial situation or needs. Consider whether this advice is right for you. Consider the Product Disclosure Statement and Target Market Determination before making a purchase decision. Canstar provides an information service. It is not a credit provider, and in giving you information about credit products Canstar is not making any suggestion or recommendation to you about a particular credit product. Research provided by Canstar Research AFSL and Australian Credit Licence No. 437917. You must not reproduce, transmit, disseminate, sell, or publish information on this website without prior written permission from Canstar.