ASX 200 weekly wrap: Woolies, Coles & CSL help lift the market

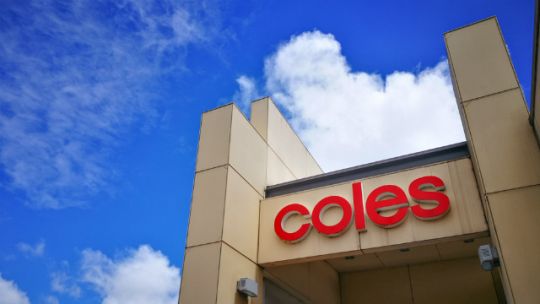
Strength from retail stocks, including Woolworths and Coles, helped offset weakness from the banking sector to lead the local share market higher last week.

The benchmark S&P/ASX 200 rose 0.45% to 5,906 points, while the broader All Ordinaries index gained 0.50% to finish last week at 5,971 points.
Standouts were the retail-related consumer discretionary and consumer staples sectors, which each rose more than 2%, while the financials and the mining-related materials sectors fell 0.74% and 0.92%, respectively.
Coles’ shares dipped at the end of last week after it announced a $146 million pre-tax provision as part of its plan to build automated distribution centres.
Investors reacted negatively to the outlay, however it was not enough to outweigh Coles’ gains earlier in the week off the back of strong wider market gains, according to CMC Markets’ chief analyst Michael McCarthy.
Canstar General Manager of Wealth Josh Callaghan said since Coles’ demerger from Wesfarmers late last year, the market was still trying to settle on what’s a fair value of the supermarket giant.
Coles and Woolworths were among the top five market value winners last week, with Coles’ adding about $574 million to its market value and Woolies’ market cap rising by about $738 million.
Healthcare giant CSL had the biggest market value gain last week, with its market cap growing by $1.3 billion.
| ASX 200 Listed Companies – Top 5 Biggest Market Cap Gains and Losses (18/01/2019 to 25/01/2019) | |||||||||||
| Biggest Gains | Biggest Losses | ||||||||||
| Rank | Company | $ Change in Market Cap | Closing Share Price | % Change in Share Price | Rank | Company | $ Change in Market Cap | Closing Share Price | % Change in Share Price | ||
| 1 | CSL (CSL) | $1,345,285,518 | $199.16 | 1.5% | 1 | Resmed (RMD) | -$2,650,390,559 | $14.47 | -11.4% | ||
| 2 | Woolworths (WOW) | $737,753,497 | $30.52 | 1.9% | 2 | Commonwealth Bank (CBA) | -$1,221,465,260 | $72.54 | -0.9% | ||
| 3 | Aristocrat Leisure (ALL) | $664,085,916 | $24.60 | 4.4% | 3 | Challenger (CGF) | -$1,063,462,667 | $7.49 | -18.9% | ||
| 4 | Transurban (TCL) | $641,188,085 | $12.10 | 2.0% | 4 | AMP (AMP) | -$939,977,068 | $2.34 | -12.0% | ||
| 5 | Coles (COL) | $573,589,769 | $12.75 | 3.5% | 5 | Westpac (WBC) | -$930,844,176 | $25.88 | -1.0% | ||
| Prepared by Canstar. Prices taken as of week to week close. | |||||||||||
Among the best share price performers, were electronics and furniture retailer Harvey Norman and Supercheap Auto owner Super Retail Group, with rises of more than 11% each.
Mr Callaghan said both retailers benefited from broker upgrades, which appealed to investors looking for value in the market.
“Super Retail Group hit a 52-week low in early January, so some analysts now see them as value,” he said.
Medical equipment company ResMed (RMD) was among the weakest performers on the market, with their shares falling by 11.4% to $14.47, following disappointing quarterly results.
A profit downgrade from financial firm AMP drove its shares down 12% to $2.34, slashing almost $940 million from its market value.
“News that AMP’s final dividend would be just four cents per share, down from more than 14 cents, saw a number of investors running for the door,” Mr Callaghan said.
He said he expected investors to be cautious with banking stocks in the lead up to the banking royal commission’s final report, which is set to be publicly released on Monday.
In other news, investment management giant Challenger released a weaker earnings’ outlook than the market had expected for the first half, which drove their share price down 18.9%.
| ASX 200 Listed Companies – Top 5 Biggest Share Price Gains and Losses (18/01/2019 to 25/01/2019) | |||||||
| Biggest Gains | Biggest Losses | ||||||
| Rank | Company | Closing Share Price | % Change | Rank | Company | Closing Share Price | % Change |
| 1 | Harvey Norman (HVN) | $3.63 | 11.7% | 1 | Challenger (CGF) | $7.49 | -18.9% |
| 2 | Super Retail Group (SUL) | $7.49 | 11.6% | 2 | Northern Star (NST) | $8.05 | -15.0% |
| 3 | Costa Group (CGC) | $5.62 | 11.3% | 3 | AMP (AMP) | $2.34 | -12.0% |
| 4 | Estia Health (EHE) | $2.32 | 8.9% | 4 | Resmed (RMD) | $14.47 | -11.4% |
| 5 | Healius (HLS) | $2.94 | 8.9% | 5 | Sims Metal Management (SGM) | $9.98 | -8.9% |
| Prepared by Canstar. Prices taken as of week to week close. | |||||||

Try our Online Share Trading comparison tool to instantly compare Canstar expert rated options.


