The suburbs where rents dropped the most in April

Rental prices have dropped over the past few months, partly thanks to COVID-19 which may be good news if you’re looking for a place to rent. CoreLogic has identified the suburbs in each state and territory where rental prices fell the most in April.
Residential rental markets are seeing additional supply, and significantly less demand amid COVID-19. In the coming months, this could mean reduced rental prices and yields. For those still in secure employment, it may mean being able to find cheaper rentals in desirable locations.
Just take a look at the table below which shows inner-city suburbs (within 20km of CBD) in each state and territory where rental prices fell the most in April.
Inner-City Suburbs where Rental Prices Fell most
| State | Suburb Name | Change in rents 31 March – 30 April |
Weekly Median Rent Value April 2020 |
Distance to CBD (KM) |
|---|---|---|---|---|
| Australian Capital Territory | Campbell | -1.3% | $740.09 | 2.9 |
| Australian Capital Territory | O’Connor | -1.2% | $693.97 | 3.1 |
| Australian Capital Territory | City | -1.2% | $621.48 | 0.0 |
| Australian Capital Territory | Dickson | -1.1% | $634.38 | 3.3 |
| Australian Capital Territory | Kingston | -1.0% | $573.60 | 4.0 |
| South Australia | North Adelaide | -1.3% | $453.85 | 2.1 |
| South Australia | Adelaide | -1.0% | $466.71 | 0.2 |
| South Australia | Norwood | -0.8% | $461.11 | 3.0 |
| South Australia | Henley Beach | -0.8% | $477.06 | 9.4 |
| South Australia | Northgate | -0.6% | $434.75 | 8.4 |
| Queensland | Hawthorne | -1.7% | $537.98 | 3.2 |
| Queensland | South Brisbane | -1.6% | $500.23 | 1.3 |
| Queensland | Brisbane City | -1.6% | $526.74 | 0.5 |
| Queensland | Spring Hill | -1.5% | $433.63 | 1.5 |
| Queensland | Fortitude Valley | -1.5% | $424.30 | 1.8 |
| Northern Territory | Nightcliff | -0.8% | $375.67 | 9.1 |
| Northern Territory | Coconut Grove | -0.6% | $346.30 | 7.7 |
| Northern Territory | Bellamack | -0.3% | $515.56 | 15.8 |
| Northern Territory | Leanyer | -0.3% | $452.19 | 11.4 |
| Northern Territory | Durack | -0.3% | $478.93 | 13.6 |
| Tasmania | West Hobart | -2.4% | $556.23 | 2.1 |
| Tasmania | Battery Point | -2.3% | $571.25 | 0.9 |
| Tasmania | Sandy Bay | -2.3% | $569.38 | 3.2 |
| Tasmania | Hobart | -2.2% | $557.16 | 0.1 |
| Victoria | Southbank | -3.1% | $577.84 | 1.2 |
| Victoria | Docklands | -3.0% | $600.51 | 3.1 |
| Victoria | Melbourne | -2.6% | $555.07 | 0.8 |
| Victoria | West Melbourne | -2.2% | $523.65 | 3.9 |
| Victoria | Carlton | -2.1% | $495.33 | 2.6 |
| Western Australia | Cottesloe | -1.0% | $871.96 | 10.5 |
| Western Australia | Mosman Park | -0.7% | $754.26 | 10.9 |
| Western Australia | Nedlands | -0.7% | $811.41 | 5.8 |
| Western Australia | Wilson | -0.7% | $385.61 | 9.2 |
| Western Australia | Willetton | -0.6% | $437.22 | 11.4 |
| New South Wales | Haymarket | -3.6% | $826.02 | 2.2 |
| New South Wales | Millers Point | -3.5% | $921.43 | 0.3 |
| New South Wales | Sydney | -3.4% | $743.78 | 0.7 |
| New South Wales | Vaucluse | -3.0% | $975.90 | 6.5 |
| New South Wales | Bronte | -2.8% | $877.31 | 7.1 |
Source: CoreLogic. Note – data is based on changes in the monthly CoreLogic hedonic rental index, which captures value changes across the whole rental market. Only suburbs with a minimum of 20 rental listings per month have been considered in this analysis.

Why rental prices have fallen
In the lead up to COVID-19, growth in Australian rent values was low. The annual rate of growth in rent values had been falling between August 2017 and May 2019 due to a surge in investment activity. This was acute across Brisbane, Sydney and Melbourne, where a large supply of new units had created more choice for tenants, and more competitive pricing among landlords.
COVID-19 presents new challenges to the rental prices, which already declined in April. This has dragged the annual growth in national rents to just 0.8% in the 12 months to April 2020.

The factors contributing to falling rental prices include:
- Travel bans: The Australian government has progressively handed down border restrictions since the beginning of February. The loss of tourism led to a decline in demand for short term rental accommodation (such as Airbnbs), which has prompted some owners to convert these to the long-term rental market, increasing supply.
- International border closures: slowed long-term migration has created a demand shock for rental properties, because a high portion of new migrants are renters.
- Job and income losses: Job losses are another factor dampening rental demand. ABS analysis of payroll data suggests that between 14 March and 18 April, total employee jobs declined by 7.5%, and wages paid by employers fell 8.2%.
What happened to rent values around Australia in April?
Rent values declined by 0.4% over the month of April Australia-wide, with median asking rents for dwellings valued at $440. Of the greater capital city and “rest of state” regions, 10 of 15 regions saw a decline in values over the month.
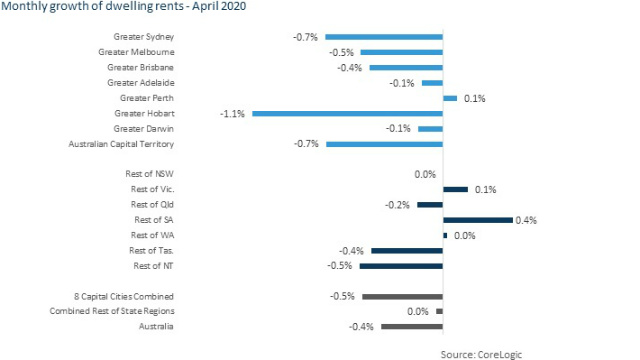
Hobart has been hit the hardest
Greater Hobart had the highest decline in rental values of the capital cities over April, at -1.1%. This is a significant reversal for the Hobart rental market, where rents have seen annualised growth of 5.6% for the past five years. Even without the fall in demand as a result of COVID-19, rental affordability pressures were already contributing to weaker growth in recent months.
According to the latest CoreLogic affordability metrics, typical Hobart rents require 34.0% of local incomes to service each week, which is the highest portion of income expended on rents of the capital city markets.
For Hobart, COVID-19 will more severely impact rental demand, because the kinds of industries that have seen the largest job losses (accommodation and food services, arts and accommodation services), made up a relatively high portion of the Hobart workforce (approximately 12.7%).
Additionally, Inside Airbnb figures compared with CoreLogic estimates of stock suggest Airbnb properties represent about 2% of housing in Tasmania, and over 5% across the Hobart region. Therefore border closures and a lack of tourism may have prompted the conversion of a relatively large amount of stock to the long-term rental market. For Hobart locals seeing cheap rentals coming to market, it is worth noting that once tourism resumes across the state, this added stock may be reverted.
A look at the other capital cities
Across the capital cities, the next largest declines were seen across Sydney, the ACT and Melbourne. Parts of Sydney and Melbourne have been especially hard-hit by a decline in overseas arrivals.
As an example, migration data from 2019 suggests that virtually all the population increase to the Melbourne City Council region was attributable to net overseas migration. This steady stream in overseas migration had sustained steady rents, even as high levels of supply came to market. The Inner Melbourne region saw the highest increase in rent listings, at 36.2%, between 22 March and 26 April.
This is why many of the suburbs that have seen the largest decline in rent values are those in the inner city. Inner city regions tend to have high exposure to net overseas migration, and many renting households working in affected industries such as tourism, hospitality and the arts.
Across Adelaide and Darwin, rents were relatively steady over the month of April, and Perth even saw a slight increase in rent values.
This is not to say that economies and housing markets will be untouched by COVID-19 in these cities. In fact, South Australia is a state where a high portion of new housing demand is reliant on net overseas migration, which accounted for an average 96.1% of population increase over the past five years. However, the effect on rental markets may be less pronounced due to the relatively low levels of new property development across these cities. The COVID-19 downturn is likely to see the rental market take a disproportionate decline in values relative to purchase prices.
Main image source: Solis Images (Shutterstock)

About Eliza Owen
Eliza Owen is the Head of Residential Research Australia at CoreLogic Australia. Eliza has a wealth of experience in property data analysis and reporting. She worked as an economist at Residex, a research analyst at Domain Group and previously as the commercial real estate and construction analyst at CoreLogic. Alongside her career in property data and research, Eliza is passionate about explaining economic concepts to broader audiences. She unpacked housing affordability on the TEDX stage, and has been a regular commentator for The Sydney Morning Herald, The Age, the ABC and commercial radio and television. Eliza is also a popular keynote speaker, having presented to thousands in real estate, construction, banking and finance and property development, as well as consumer audiences. She holds a first class honours degree in economics from the University of Sydney. Follow her on X.


 Owner occupied
20% min deposit
Redraw facility
Owner occupied
20% min deposit
Redraw facility
Try our Home Loans comparison tool to instantly compare Canstar expert rated options.


