Top 10 richest and poorest suburbs in Australia
Latest data shows six of Australia’s 10 highest-earning postcodes are located in Sydney, while four of the lowest-earning postcodes are in regional Queensland.
Latest data shows six of Australia’s 10 highest-earning postcodes are located in Sydney, while four of the lowest-earning postcodes are in regional Queensland.
Each year, the Australian Taxation Office (ATO) undertakes a survey of tax return data from around the country, to give a snapshot of earning patterns, including areas of highest and lowest income. The most recent survey data, from the 2021-2022 financial year, analyses the tax returns of 15.5 million Aussies, finding the richest postcodes with the highest average taxable income, as well as the poorest postcodes with the lowest average taxable income.
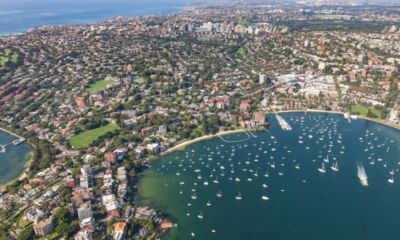
The New South Wales suburb of Double Bay took out the top spot as the richest suburb in Australia, with data from the ATO showing that residents in the 2028 postcode had an average taxable income of $354,308. This is almost five times more than the national average of $72,327.
The richest postcodes list was mostly dominated by affluent areas of Sydney, however, Western Australia’s 6011 postcode (which includes Cottesloe and Peppermint Grove) came in second with an average income of $295,283. This was followed by the 2027 postcode (which includes Darling Point, Edgecliff, HMAS Rushcutters and Point Piper) with an average income of $230,597.
For the poorest postcodes, Newcastle’s 2308 postcode, (which includes Callaghan and Newcastle University) reported the lowest average taxable incomes of $20,878. The 2052 postcode, which covers the University of New South Wales, was the second lowest with an average income of $20,892. This top two seems skewed by being in areas where most of the population are either studying or working lower paying casual or part time jobs, as many university students tend to do. In third place was the South Australian postcode of 5308, about two hours east of Adelaide (which includes Copeville, Galga, Mantung, Mercunda and Perpond). It had an average income of $21,049.
What are the richest suburbs in Australia?
Based on the ATO’s latest taxation figures, the highest-earning suburb in Australia is Sydney’s Double Bay in New South Wales. See the full list of postcodes below.
← Mobile/tablet users, scroll sideways to view full table →
| Ranking | Postcode | Suburb and state/territory |
Individuals | Average taxable income |
|---|---|---|---|---|
| 1 | 2028 | Double Bay – NSW | 3,304 | $354,308 |
| 2 | 6011 | Cottesloe, Peppermint Grove – WA |
6,704 | $295,283 |
| 3 | 2027 | Darling Point, Edgecliff, HMAS Rushcutters, Point Piper – NSW |
5,703 | $269,777 |
| 4 | 3142 | Hawksburn, Toorak – VIC |
9,540 | $266,020 |
| 5 | 2023 | Bellevue Hill – NSW | 7,193 | $245,728 |
| 6 | 2030 | Dover Heights, HMAS Watson, Rose Bay North, Vaucluse, Watsons Bay – NSW |
9,590 | $239,974 |
| 7 | 3944 | Portsea – VIC | 586 | $221,867 |
| 8 | 2108 | Coasters Retreat, Currawong Beach, Great Mackerel Beach, Palm Beach – NSW |
1,283 | $216,262 |
| 9 | 2110 | Hunters Hill, Woolwich – NSW |
6,062 | $215,456 |
| 10 | 2025 | Woollahra – NSW | 4,978 | $215,123 |
Source: Australian Taxation Office (ATO). Taxation Statistics 2021-22 Individuals: Top 10 highest-earning postcodes by average taxable income, 2021-22 income year. Table ordered by highest to lowest average taxable income.
What are the poorest suburbs in Australia?
According to the ATO’s latest figures, the lowest-earning suburbs in Australia are Callaghan and Newcastle University, which are located in the city of Newcastle in New South Wales. See the full list of postcodes below.
← Mobile/tablet users, scroll sideways to view full table →
| Ranking | Postcode | Suburb and state/territory |
Individuals | Average taxable income |
|---|---|---|---|---|
| 1 | 2308 | Callaghan, Newcastle University – NSW |
236 | $20,878 |
| 2 | 2052 | University of New South Wales – NSW |
140 | $20,892 |
| 3 | 5308 | Copeville, Galga, Mantung, Mercunda, Perponda – SA |
65 | $21,049 |
| 4 | 4611 | Marshlands, Mondure – QLD |
80 | $27,461 |
| 5 | 4423 | Glenmorgan, Teelba – QLD |
132 | $27,875 |
| 6 | 4728 | Jericho – QLD | 123 | $28,889 |
| 7 | 3889 | Bellbird Creek, Bemm River, Cabbage Tree Creek, Club Terrace, Combienba – VIC |
70 | $29,050 |
| 8 | 4732 | Muttaburra – QLD | 85 | $30,307 |
| 9 | 5309 | Borrika, Halidon, Mindarie, Sandalwood – SA |
51 | $30,788 |
| 10 | 2397 | Bellata, Jews Lagoon, Millie – NSW |
222 | $31,972 |
Source: Australian Taxation Office (ATO). Taxation Statistics 2021-2022 Individuals: Top 10 lowest-earning postcodes by average taxable income, 2020-2021 income year. Table ordered by lowest to highest average taxable income.
Compare Home Loans (Refinance with variable rate only) with Canstar
If you’re currently considering a home loan, the comparison table below displays some of the variable rate home loans on our database with links to lenders’ websites that are available for homeowners looking to refinance. This table is sorted by Star Rating (highest to lowest), followed by comparison rate (lowest to highest). Products shown are principal and interest home loans available for a loan amount of $500,000 in NSW with an LVR of 80% of the property value. Consider the Target Market Determination (TMD) before making a purchase decision. Contact the product issuer directly for a copy of the TMD. Use Canstar’s home loans comparison selector to view a wider range of home loan products. Canstar may earn a fee for referrals.

 Owner occupied
20% min deposit
Redraw facility
Owner occupied
20% min deposit
Redraw facility
Owner occupied
20% min deposit
Redraw facility
Owner occupied
10% min deposit
Redraw facility
Owner occupied
20% min deposit
Redraw facility
Owner occupied
20% min deposit
Redraw facility
Owner occupied
20% min deposit
Redraw facility
Owner occupied
10% min deposit
Redraw facility
 Owner occupied
20% min deposit
Redraw facility
Owner occupied
20% min deposit
Redraw facility


Cover image source: Ben Jeayes/Shutterstock.com
 Owner occupied
20% min deposit
Redraw facility
Owner occupied
20% min deposit
Redraw facility
Try our Home Loans comparison tool to instantly compare Canstar expert rated options.


