5 of the Most Common Financial Ratios

Financial ratios have been a handy tool for investors for some time. These ratios are used to compare a company to its peers and to the benchmark of an industry.
They can also help to assess the vital signs that measure a company’s health and allow investors to recognise a good investment. For example, some ratios can help investors identify when a stock may be overvalued.
As no ratio on its own can tell the full story, astute investors apply several different ratios before investing in a stock. We’ve explored the most common and useful ratios, so you can try them out when you’re next assessing a company.
Before you begin here’s what you’ll need
To calculate the below ratios you will need the financial statement of the company that you are assessing. Financial statements can usually be found in a company’s annual report. More often than not you can get your hands on a company’s annual report by downloading it from their website.
For a refresher on stocks and shares check out this article.
1) EPS
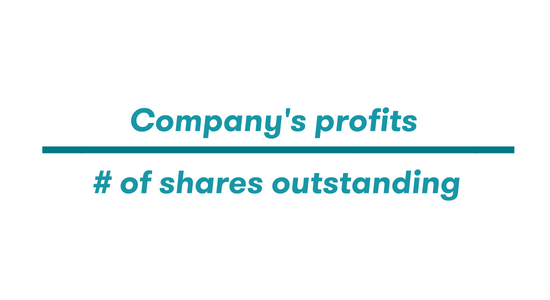
The first cab off the rank is not quite a ratio, it’s more of a calculation. The EPS (or earnings per share) is needed to calculate other ratios – so it’s a good place to start. The earning per share calculation can help an investor measure the profitability of a company.
This is how it’s calculated:
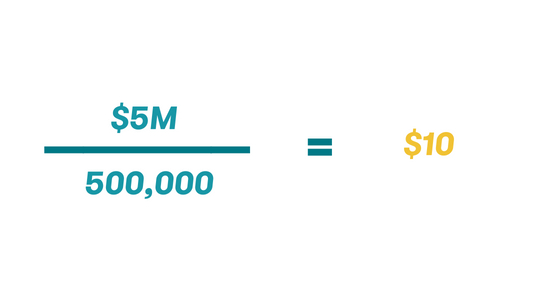
Here’s an example:
During the last financial year, Tina’s Turkish Towels (an imaginary company) made a profit of $5 million and they have 500,000 shares outstanding. Their earnings per share (EPS) is $10, as shown below.
There is no definitive number to indicate a good EPS. Instead, it is best used when comparing two companies to each other and to calculate other ratios.
2) P/E ratio – the earnings multiplier
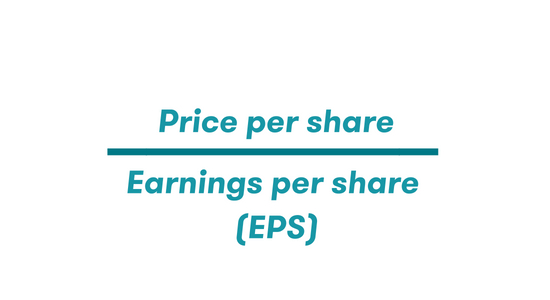
The price-earnings ratio (P/E) is used to measure the amount an investor needs to invest to receive one dollar of a company’s earnings. This can help investors evaluate if the share price is overvalued compared to its peers. To calculate this ratio, you need the company’s financial statement and the most recent stock price. You will also need to have the EPS of the company. Luckily, we covered that above.
This is how it’s calculated:
 Here’s an example:
Using the example of Tina’s Turkish Towels, we now know that the EPS is $10 and let’s say that currently their share price is listed as $20.
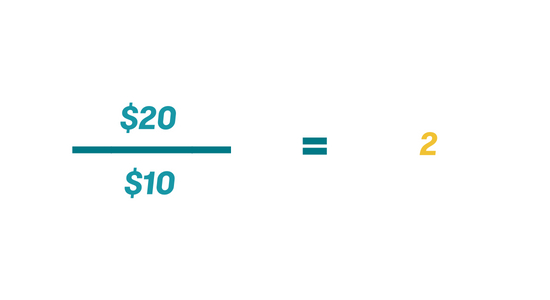
According to this ratio an investor will need to invest $2 to receive one dollar of the company’s earnings. The long-term average P/E of the all ordinaries index is 15. However, this ratio is best applied when comparing a company to the average P/E ratio in that industry or to a competitor. For example, if an investor wanted to invest in Turkish towels they could compare Tina’s P/E ratio with that of Gina’s Turkish Towels. All things being equal, the Turkish towel company with the lowest P/E ratio should represent the best value.
Compare Online Share Trading Platforms
3) PEG ratio – the stock value test
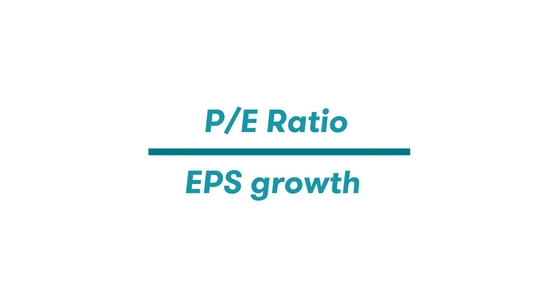
Now that we have the P/E ratio and the EPS of a company, we can then calculate the PEG ratio which is also known as price to earnings to growth. This ratio offers investors a way to evaluate a stock’s price compared to the anticipated earnings of a company. To calculate the PEG ratio, you need to divide the P/E ratio of the company by their EPS growth. The EPS growth is calculated by taking the difference between company’s current EPS to their EPS in the previous year, and this is represented as a percentage.
This is how it’s calculated:
 Here’s an example:
We know now that Tina’s Turkish Towels has a P/E of 2 and let’s say the EPS growth is 10%. Putting that together we get:
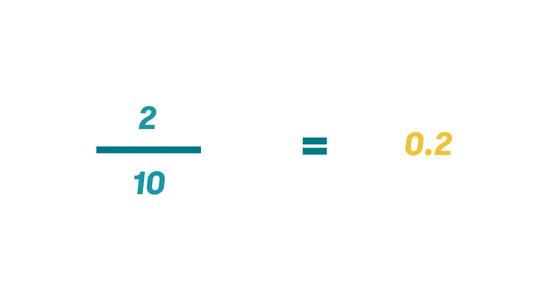
Generally speaking, a correctly priced stock will have a PEG ratio of one. Therefore, anything under one is potentially good value and anything above one may be overvalued. In this case, Tina’s Turkish Towels is looking like a good investment, but it’s likely that more analysis is needed.
4) Dividend yield – the ‘bang for your buck’ estimator
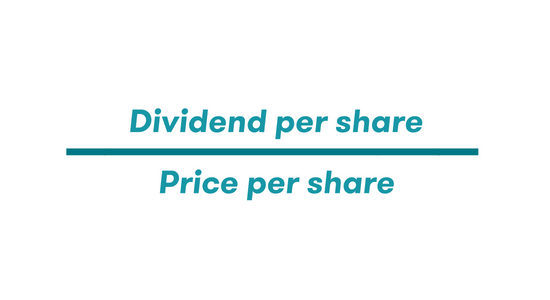
Most useful for income focused investors, the dividend yield indicates the relationship between how much a company pays in dividends each year and its share price. This ratio, which is expressed as a percentage, can tell an investor how much the company’s previous dividend payments were in comparison to the current price.
This is how it’s calculated:
Here’s an example:
The annual dividend per share that Tina’s Turkish Towels pays out is $2. We calculated this taking number of dividends ($1 million) and dividing it by the shares outstanding (500,000). We also know that the price per share is $20, so it looks like this:
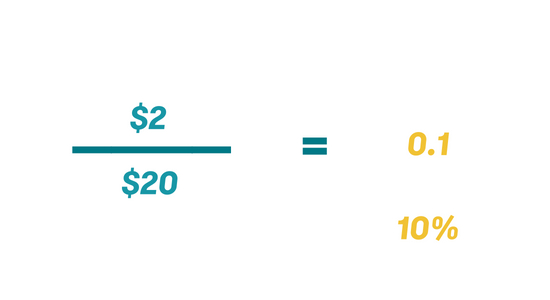
In this example, an income focused investor would generally be quite pleased with a 10% return. It is worth noting that because this ratio uses prior dividend payments it’s not able to calculate actual yield that investors might get on the stock. Also, a company can choose to lower or eliminate dividends at any point. However, with companies that consistently pay dividends, like many Australian companies, it does provide a useful insight on the potential returns available based on the current share price.
5) P/B ratio – the company health checker
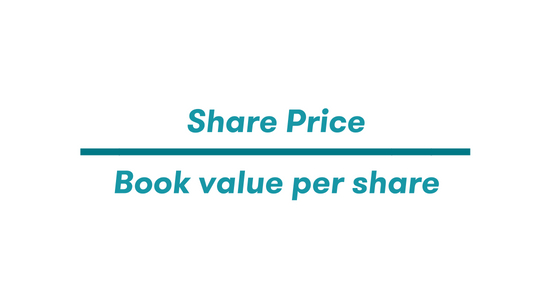
The price to book (P/B) ratio compares the cost of a stock to the value of a company if all its assets were sold and debts were paid off, this is known as the book value. The book value of a company can be found on the balance sheet often under the name ‘shareholder equity’. This ratio helps investors understand the value of a company. When a company’s book value is below the market price, the company may be overvalued. The company may be undervalued if the opposite is true.
This is how it’s calculated:
Here’s an example:
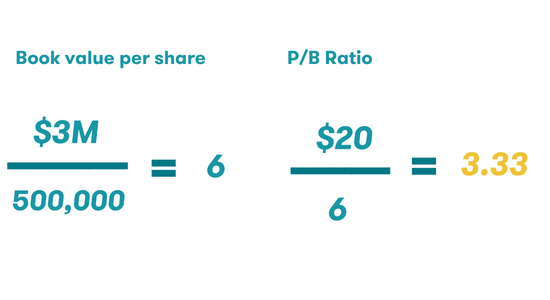
Before we can calculate the P/B ratio we need to determine the book value per share. Let’s say Tina’s Turkish Towels has a book value of $3 million, and we already know that there are 500,000 shares outstanding. We also know that the share price is $20, so:
As is the case with the above ratios, the P/B of a company is best used when comparing to another company or to the industry benchmark. A lower P/B ratio can indicate that a stock is undervalued and may be a good investment. However, there could be a hidden story. In the case of P/B ratio, a low outcome may mean that the market doesn’t hold as much value in the assets as the company does, and therefore isn’t willing to pay much for them.
Ratios are just one piece of the puzzle
The above ratios and calculations are just a few of the many ways to evaluate stocks and help investors make informed investment decisions. It is worth keeping in mind that all financial ratios should be used in the proper context and in conjunction with other analytical processes.
| Provider | Fee for $15K trade* | Ongoing fees# | Trade with live prices^ | |
|---|---|---|---|---|
 |
$15.00 | Yes | Yes | |
|
$7.50 | Yes | Yes | |
|
$14.98 | Yes | Yes |
View all Canstar rated Online Share Trading products. View Disclosures.
* Online brokerage fee for a $15,000 trade based on the number of transactions specified in the search inputs
# Ongoing fee for the account. There may be waivers and discounts subject to account use
^ The ability to view and trade on live prices
Compare Online Share Trading Platforms
Thanks for visiting Canstar, Australia’s biggest financial comparison site*

This article was reviewed by our Content Producer Isabella Shoard before it was updated, as part of our fact-checking process.

Try our Investor Hub comparison tool to instantly compare Canstar expert rated options.