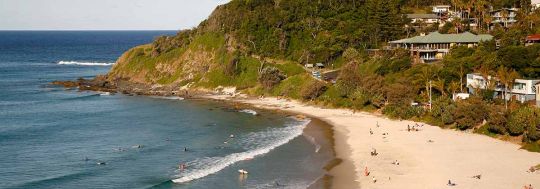
CoreLogic has revealed the areas in Australia that have over- and under-performed over the 20 years to December 2016.
The property analytics firm CoreLogic reported that over the past 20 years, the median selling prices of houses nationally increased at a compound annual rate of 7.2% p.a.
This means property prices have on average doubled over the space of 10 years.
“While the national growth rate is strong, the rate of growth has varied dramatically between the states and territories, and within different regions of each state and territory,” CoreLogic reported.
Of the 25 best-performing council areas (over a 20-year basis), 17 of them came from Victoria.
Next on the list was NSW with 5 council areas, followed by QLD with 2, and WA with 1.
While the list is littered with high median prices (many exceeding $1 million), number one on the list, Murrumbidgee, only has a median price of $167,000 despite seeing an annual growth rate of 13%.
Here’s the full list of the 25 best-performing council areas for median house price increases in Australia:
Council area | State | Median house price | 20 year growth p.a. |
---|---|---|---|
Murrumbidgee | NSW | $167,000 | 13.0% |
Isaac | Qld | $140,000 | 11.5% |
Monash | Vic | $1,100,000 | 10.8% |
Whitehorse | Vic | $1,081,000 | 10.7% |
Boroondara | Vic | $1,910,000 | 10.6% |
Glen Eira | Vic | $1,328,000 | 10.6% |
Maribyrnong | Vic | $781,500 | 10.6% |
Yarra | Vic | $1,210,000 | 10.2% |
Darebin | Vic | $840,000 | 10.2% |
Banana | Qld | $190,000 | 10.0% |
Bayside | Vic | $1,658,750 | 9.9% |
Boorowa | NSW | $235,000 | 9.8% |
Manningham | Vic | $1,170,000 | 9.8% |
Stonnington | Vic | $1,810,000 | 9.8% |
Kingston | Vic | $851,000 | 9.8% |
Nannup | WA | $372,000 | 9.7% |
Port Phillip | Vic | $1,550,000 | 9.7% |
Liverpool | NSW | $750,000 | 9.6% |
Byron | NSW | $800,000 | 9.6% |
Greater Dandenong | Vic | $600,000 | 9.6% |
Marrondah | Vic | $745,000 | 9.6% |
Waverley | NSW | $2,625,000 | 9.5% |
Hobsons Bay | Vic | $771,000 | 9.5% |
Moreland | Vic | $740,000 | 9.5% |
Moonee Valley | Vic | $955,000 | 9.5% |
Source: CoreLogic, 2017
The list of worst-performing council areas is slightly more diverse as far as state representation goes.
QLD won the dubious honour of most entries with 8 council areas, and WA follows with 7, SA with 5, Vic with 3, and NSW with 2.
It’s not entirely surprising that there aren’t many entries from Victoria or NSW on the list; their property markets have been booming for the past few years, and not just in urban areas either.
The median house prices on this list are comparably lower than on the ‘best-performing’ list.
Many of the councils listed below have median prices below $100k, and the highest median price is only $405,000.
Here are the worst-performing council areas for median house price increases in Australia:
Council area | State | Median house price | 20 year growth p.a. |
---|---|---|---|
Coolgardie | WA | $87,500 | 0.4% |
Yilgarn | WA | $58,500 | 0.5% |
Dundas | WA | $33,000 | 1.0% |
Paroo | Qld | $50,000 | 1.9% |
Unincorporated SA | SA | $46,000 | 2.5% |
East Pilbara | WA | $150,000 | 2.8% |
Hay | NSW | $120,000 | 2.9% |
Kimba | SA | $70,000 | 3.0% |
Morawa | WA | $60,000 | 3.0% |
Burdekin | QLD | $175,000 | 3.2% |
Quilpie | QLD | $87,500 | 3.2% |
Walgett | NSW | $80,000 | 3.2% |
Buloke | Vic | $82,750 | 3.2% |
Blackall Tambo | QLD | $75,000 | 3.3% |
Central Highlands | QLD | $190,000 | 3.5% |
Bruce Rock | WA | $70,250 | 3.5% |
Roebourne | WA | $291,000 | 3.8% |
Cassowary Coast | QLD | $250,000 | 3.8% |
Yarriambiack | Vic | $90,000 | 3.9% |
Southern Mallee | SA | $99,000 | 4.1% |
Tatiara | SA | $142,000 | 4.1% |
Gannawarra | Vic | $160,000 | 4.2% |
Douglas | QLD | $405,000 | 4.3% |
Berri and Bermera | SA | $181,000 | 4.3% |
North Burnett | QLD | $146,000 | 4.4% |
Source: CoreLogic, 2017
For the week ending 26 March 2017, these are CoreLogic’s updated median price figures for houses and units in the capital cities:
City | Median house price | Median unit price | Year-to-date change |
---|---|---|---|
Sydney | $950,000 | $740,000 | +5.3% |
Melbourne | $710,000 | $525,000 | +4.4% |
Brisbane | $505,000 | $392,000 | +0.3% |
Adelaide | $446,750 | $323,250 | +1.8% |
Perth | $510,000 | $418,500 | -1.1% |
Hobart | $365,000 | $306,500 | N/A |
Darwin | $493,000 | $295,500 | N/A |
Canberra | $665,000 | $405,000 | N/A |
Source: CoreLogic, 2017
Any advice provided on this website is general and has not taken into account your objectives, financial situation or needs. Consider whether this advice is right for you. Consider the Product Disclosure Statement and Target Market Determination before making a purchase decision. Canstar provides an information service. It is not a credit provider, and in giving you information about credit products Canstar is not making any suggestion or recommendation to you about a particular credit product. Research provided by Canstar Research AFSL and Australian Credit Licence No. 437917. You must not reproduce, transmit, disseminate, sell, or publish information on this website without prior written permission from Canstar.