Australian Shares Performance in the Last 30 Years

For the past twenty years, Vanguard Australia have produced an index chart tracking the 30-year performance of major asset class indices. The 2022 chart demonstrates that despite stock market crashes, a global pandemic, natural disasters, a succession of governments and the Global Financial Crisis (GFC), Australian shares have performed well.
What were the performance results?
The Vanguard data assumes no transaction costs or taxes and the reinvestment of all income, with a $10,000 investment in 1991 potentially achieving the following growth:
| $10,000 Investment in 1992 |
Investment value in 2022 |
Per annum returns |
|---|---|---|
| Australian Shares | $131,413 | 9.8% |
| US Shares | $182,376 | 11.7% |
| Australian listed Property | $90,243 | 9.3% |
| International Shares | $94,184 | 9.1% |
| Australian Bonds | $55,588 | 6% |
| Cash | $35,758 | 4.4% |
Vanguard’s chart which we can view here, shows that Australian shares have performed well as an asset class, with an average return of 9.8% per annum, second only to the return of US shares of 11.8% p.a. Listed property has also done well returning 9.3% on average per annum over 30 years, followed very closely by International shares.
Looking at the full track record for these asset classes over the last 30 years, we can see just how volatile the markets can be, and how quickly fortunes can turn around. As expected of low-risk asset classes, bonds, cash and the consumer price index (CPI) have made steady, consistent gains.
Compare Online Share Trading Accounts with Canstar
If you’re comparing online share trading companies, the comparison table below displays some of the companies available on Canstar’s database with links to providers’ websites. The information displayed is based on an average of six trades per month. Please note the table is sorted by Star Rating (highest to lowest), followed by provider name (alphabetical). Consider the Target Market Determination (TMD) before making a purchase decision. Contact the product issuer directly for a copy of the TMD. Use Canstar’s Online Share Trading comparison selector to view a wider range of online share trading companies. Canstar may earn a fee for referrals.
| Provider | Star rating^^ | Fee for $15K trade^ | Ongoing fees# | |
|---|---|---|---|---|
 |
$15.00 | N/A | ||
|
$15.00 | N/A | ||
|
$14.98 | N/A | ||
|
$0 | N/A |
View all Canstar rated Online Share Trading products. View Disclosures.
^^ Star ratings are awarded by research analysts based on an evaluation of price and features
^ Online brokerage fee for a $15,000 trade based on the number of transactions specified in the search inputs
# Ongoing fee for the account. There may be waivers or discounts subject to account use
Australian Stock Market Graph
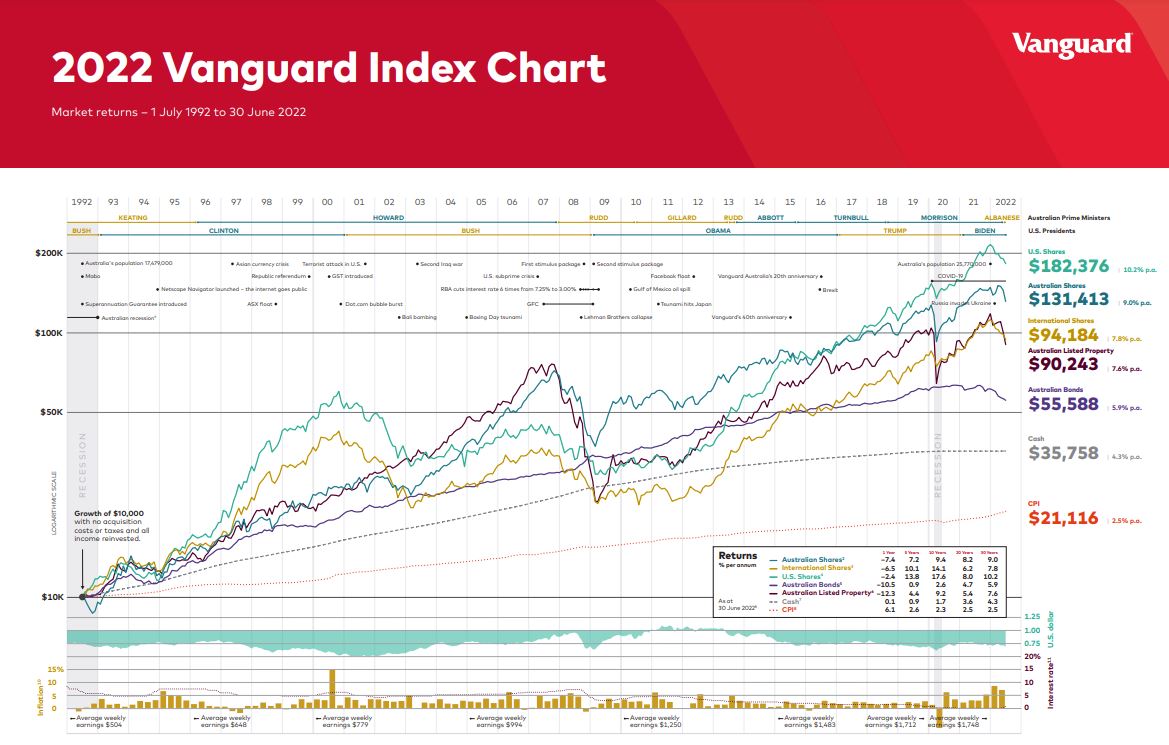
Vanguard’s Index Chart tracks the performance of major asset class indices across the 30 preceding years. You can access the 30-year chart with accompanying table and commentary here.
Overseas share markets
It has not been smooth sailing for international shares, crashing from a high just prior to the GFC that saw greater returns than any other asset, to lower than even the performance of cash. While they have recovered significantly since that crash, they still aren’t performing as well compared to the rest of the market. US shares and listed property also show the huge impact of the GFC, as well as the burst of the dot com bubble in the US. Both asset classes have recovered well though, making strong gains in the last decade despite the most recent market slump.
Local share market
Australian shares too have had a rocky time, chiefly with the GFC and the Coronavirus crash, but overall the past 30 years has been smoother than other assets. Particularly interesting is the rapid recovery our local shares had from the depths of the GFC; this may have been due to the stimulus packages that were introduced. While this didn’t fully counteract the losses, it did mean that Australian shares didn’t experience as long and sustained a downturn as US and International shares did.
→ Related article: Keep saving or start investing?
The importance of diversification
As Vanguard highlights in their report, the data shows the importance of diversifying investments to help reduce volatility and receive more consistent returns. All of the asset classes surveyed had periods where they outperformed each other, and periods where they under-performed. Recessions, disasters and wars can strike without warning, sending particular markets plummeting. Although, they will likely recover over time if your portfolio is too exposed it can lead to significant setbacks.
→ Related article: Which ETFs Have the Highest Return on Investment?
Advertisement

Originally authored by Tim Smith.
Cover image by: pada stockphoto/Shutterstock.com
Thanks for visiting Canstar, Australia’s biggest financial comparison site*

This article was reviewed by our Content Producer Isabella Shoard before it was updated, as part of our fact-checking process.

Try our Investor Hub comparison tool to instantly compare Canstar expert rated options.