

Rising Stars: Canstar’s Australian Property Market Report 2024
Rising Stars – Canstar’s annual Australian Property Market Report powered by Hotspotting – is back for another year. Using a series of forward-looking indicators the Rising Stars report forecasts the prospects for annual price growth in each of the nation’s major market jurisdictions.
It ranks 14 jurisdictions nationally – comprising eight capital cities and six regional states and territories – based on five key metrics. These are sales volumes, quarterly price growth, vacancy rates, rental growth and infrastructure spending.
Each of the 14 market jurisdictions is ranked from one to 14 on each of the five metrics. These rankings are then used to determine an overall ranking for each of the jurisdictions.
We have also identified 110 ‘Rising Star’ suburbs across the country. These have been selected based on outperformance in each of the five metrics.
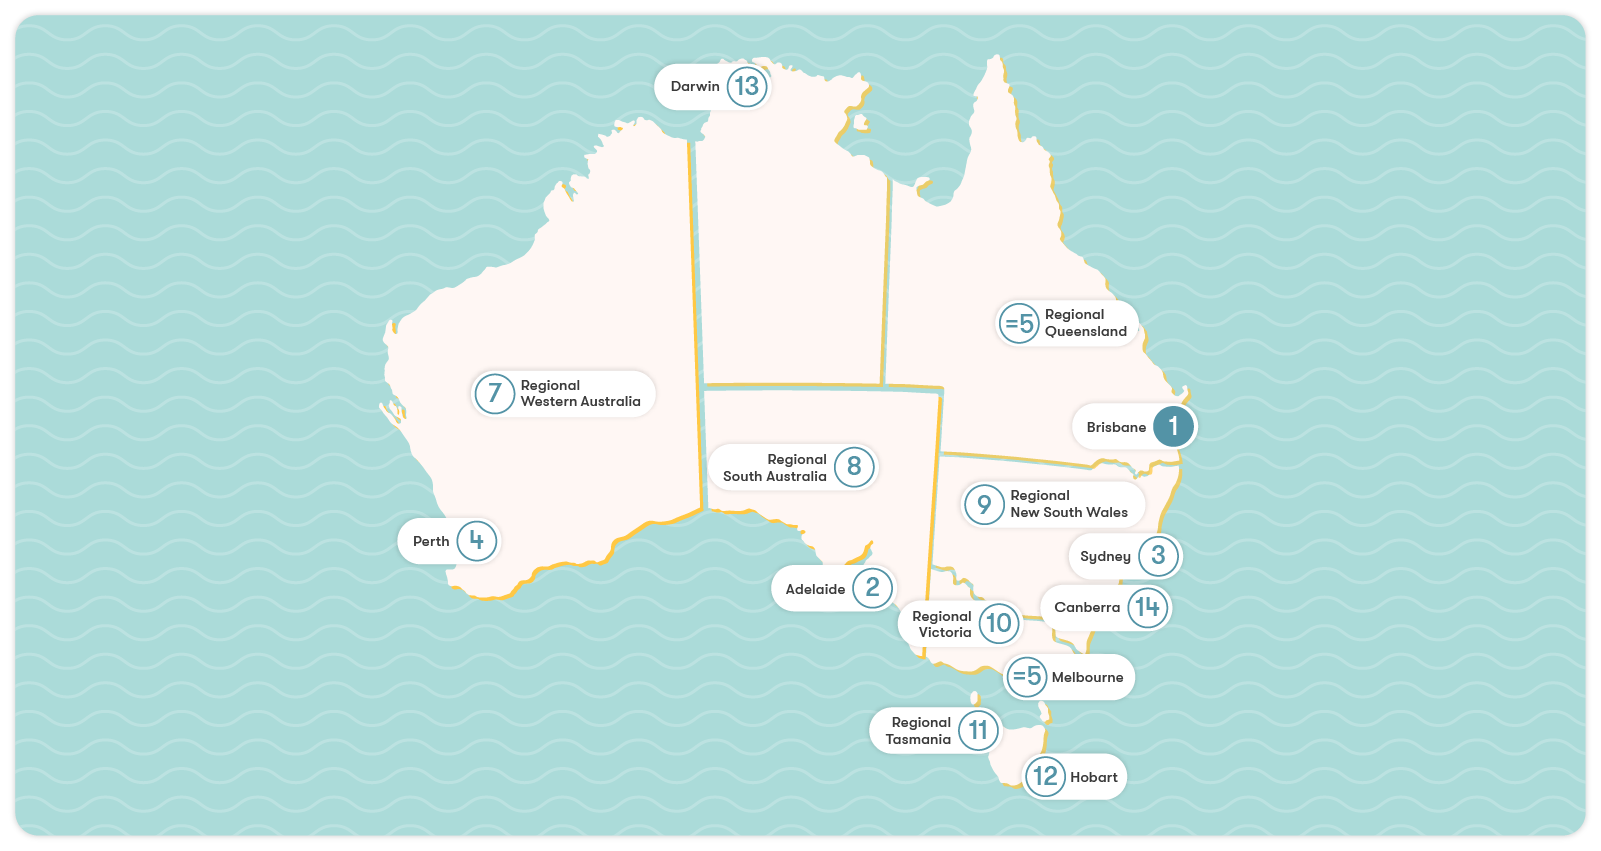
This year cemented Brisbane’s position as a property hotspot powerhouse taking out the top spot. Last year’s winner, Adelaide continued the trend of the smaller capital cities holding their own coming in at number two. However, Sydney did surge this year rising nine places in the rankings to round out the top three. Two of these top three markets – Brisbane and Sydney – have been buoyed by the impact of infrastructure investments. Brisbane has multimillion-dollar projects on the go as it prepares for the 2032 Olympics and Sydney is benefiting from business investments and governments pouring millions into transport and education.
Adelaide is a different story. Its key driver is its relative affordability compared to other jurisdictions resulting in strong house price growth signalling good prospects for future growth. In general, the major cities have outperformed the regional centres. In past years regional centres have exhibited strong growth with the exodus to regional centres driving up property prices. With the exception of Regional Queensland, which tied for 5th place, and Regional West Australia, which took out 7th place, the outlook is now much more subdued.
In last place was the ACT. The ACT is the weakest of the nation’s market jurisdictions. It is also no coincidence that the ACT has one of the weakest economies among the states and territories. This combined with the lack of infrastructure spending has put a dent in the ACT’s prospects.
Important Information
To the extent that any advice is contained in Canstar’s Australian Property Market Report (Powered by Hotspotting by Ryder), such advice is general and has not taken into account your objectives, financial situation, or needs. It is not personal advice. Consider whether this advice is right for you, having regard to your own objectives, financial situation and needs. You may need financial advice from a suitably qualified adviser. Consider the product disclosure statement (PDS) and Target Market Determination (TMD) before making a decision about a financial product. Contact the product issuer directly for a copy of the PDS and TMD. For more information, read Canstar’s Financial Services and Credit Guide (FSCG), and read our Detailed Disclosure.
This report has been prepared as a guide only and is not a recommendation about taking any particular action. We recommend that you seek professional advice from a suitably qualified adviser before electing to make any property investment decision.
All information about performance returns is historical. Past performance should not be relied upon as an indicator of future performance. The value of your investment may fall or rise. Forecasts about future performance are not guaranteed to occur.
A property investment may not be suitable for all people and the information in this report does not take into account your individual needs or investment risk profile. There are no certainties in property investment and as with any investment, there are always risks and variables that need to be taken into account.